INTEGRAL Galactic bulge Monitoring
Revolution 1942: Observation start 2018-04-15T14:49 = MJD 58223.618
Total Observation GTI = 15762 seconds
IBIS/ISGRI

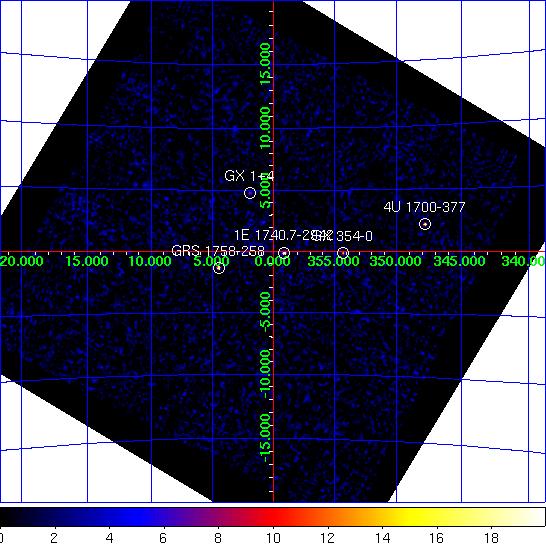
IBIS/ISGRI significance mosaic images. Left: IBIS/ISGRI 18-40 keV. Right: 40-100 keV
Sources detected > 10σ in each band are marked on the image. The table below lists the fitted position, and statistical positional uncertainty in arcmin returned by the mosaic step of
OSA10.1, of all the sources detected in the 18 - 40 keV range (band A: 1 Crab ~ 208 cps ) and 40 - 100 keV range (band B: 1 Crab ~ 100 cps ) where available.NOTES: The table is constructed from the
isgri_mosa_res.fits file - fluxes in the mosaic output are known to be systematically ~10% lower than in the ScW light-curves (see known issues). The systematic noise increases towards the edge of the field of view and NEW SOURCEs < 6σ towards the border of the image may be spurious. IBIS/ISGRI Detected Sources 18-40 keV (A) and 40-100 keV (B)
Source Name             RA       dec   +/-    l        b     A(cps)  +/-   sig  B(cps)  +/-   sig
==================== ========  ======= === ======== ======== ====== ===== ===== ====== ===== =====
4U 1700-377           255.978  -37.831 0.9  347.761   +2.187   58.1  1.63  35.5   12.0  0.59  20.3
1E 1740.7-2942        265.973  -29.740 1.1  359.117   -0.099   21.9  0.76  28.9    9.5  0.29  32.7
GRS 1758-258          270.297  -25.753 1.1    4.497   -1.362   21.1  0.75  28.2    8.8  0.28  31.3
GX 354-0              262.975  -33.836 1.1  354.295   -0.141   26.4  0.92  28.8    5.4  0.34  15.9
GX 1+4                263.017  -24.745 1.7    1.942   +4.790   12.1  0.73  16.6    0.0  0.00   0.0
SLX 1735-269          264.578  -26.982 3.1    0.810   +2.402    5.8  0.69   8.4    1.7  0.27   6.3
3A 1822-371           276.558  -37.104 3.0  356.890  -11.371   12.4  1.41   8.8    0.0  0.00   0.0
GX 9+1                270.444  -20.566 3.2    9.072   +1.087    7.6  0.94   8.1    0.0  0.00   0.0
IGR J17252-3616       261.218  -36.365 0.0  351.393   -0.347    9.0  0.00   6.8    0.0  0.00   0.0
GX 17+2               273.977  -14.044 3.7   16.412   +1.298   24.0  0.00   6.8    0.0  0.00   0.0
H 1820-303            275.918  -30.380 3.5    2.771   -7.921    6.7  0.92   7.3    0.0  0.00   0.0
IGR J17329-2731       263.279  -27.472 0.0  359.774   +3.112    4.5  0.00   6.0    0.0  0.00   0.0
GX 349+2              256.377  -36.434 3.7  349.066   +2.779    9.9  1.43   6.9    0.0  0.00   0.0
1RXS J174607.8-21333  266.730  -21.545 4.5    6.475   +3.584    4.2  0.00   5.5    0.0  0.00   0.0
Swift J174510.8-2624  266.252  -26.372 4.5    2.118   +1.453    4.0  0.00   5.5    0.0  0.00   0.0
IGR J17177-3656       259.367  -36.842 5.7  350.154   +0.602    5.2  1.21   4.3    0.0  0.00   0.0
SLX 1744-299_300      266.869  -30.034 4.6  359.272   -0.915    4.0  0.73   5.4    0.0  0.00   0.0
SAX J1712.6-3739      258.137  -37.655 3.3  348.923   +0.923   11.6  1.46   7.9    0.0  0.00   0.0
AX J1820.5-1434       275.134  -14.664 5.1   16.397   +0.017   17.1  3.55   4.8    0.0  0.00   0.0
JEM-X

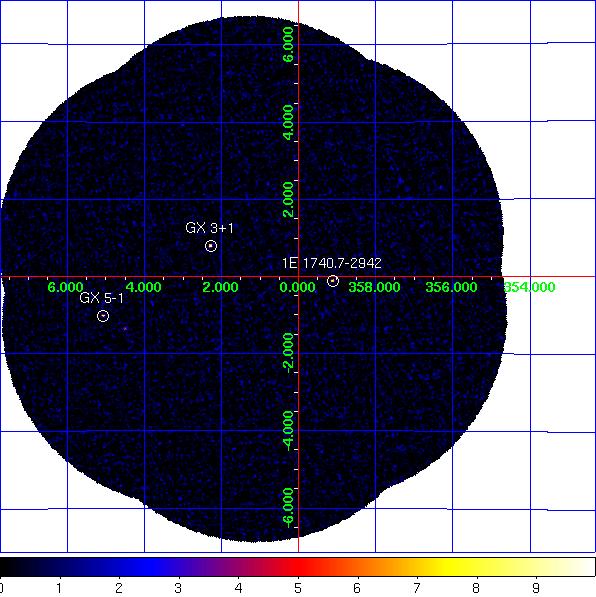
JEM-X1+2 combined significance mosaic images. Left: 3-10 keV. Right: 10-25 keV.
Sources labelled were detected in the 3-10 keV image > 6σ. The sources detected above 3σ in the 3-10 keV and/or 10-25 keV band are listed in the table below. Fluxes are extracted at the known catalogue position of the source (i.e. no fitting of the source position is done), with
mosaic_spec, in two bands: A = 3-10 keV (1 Crab ~ 97 cps [J1], 103 cps [J2]); B = 10-25 keV (1 Crab ~ 29 cps [J1], 27 cps [J2]). NOTES: The object marked as SLX 1744-299_300 is used to indicate two low-mass x-ray binaries separated by 2.7 arcminutes, SLX 1744-299 and SLX 1744-300; the position for SLX 1744-299 is used, although it can not be ruled out that SLX 1744-300 may dominate the emission some of the time. The systematic noise increases towards the edge of the field of view and in the vicinity of very bright sources, such as GX 5-1;
NEW SOURCEs < 6σ towards the border of the image and/or near GX 5-1 may, therefore, be spurious.
JEM-X1+2 Detected Sources in 3-10 keV (A) and 10-25 keV (B).
Source Name             RA       dec      l        b     A(cps)  +/-   sig  B(cps)  +/-   sig
==================== ========  ======= ======== ======== ====== ===== ===== ====== ===== =====
1A 1742-294           266.538  -29.509  359.572   -0.397    3.7  0.20  18.4    0.4  0.14   2.7
1E 1740.7-2942        265.978  -29.745  359.116   -0.106    2.7  0.22  12.3    1.3  0.16   8.1
4U 1722-30            261.885  -30.804  356.316   +2.300   13.8  0.80  17.3    1.7  0.68   2.5
GRS 1758-258          270.303  -25.741    4.511   -1.361    3.4  0.49   7.0    1.1  0.26   4.3
GX 3+1                266.977  -26.567    2.287   +0.797   25.6  0.25 103.1    1.5  0.14  10.6
GX 5-1                270.284  -25.079    5.077   -1.019   97.8  0.72 135.7    2.1  0.31   6.8
SLX 1735-269          264.571  -26.994    0.796   +2.400    2.4  0.24  10.0    0.4  0.16   2.3
SLX 1744-299_300      266.858  -29.999  359.297   -0.889    0.9  0.21   4.5    0.2  0.15   1.5
NEW SOURCE            266.309  -25.056    3.268   +2.095    1.7  0.32   5.3    0.0  0.00   0.0
NEW SOURCE            273.911  -25.376    6.406   -4.034   11.6  2.52   4.6    0.0  0.00   0.0
NEW SOURCE            264.662  -23.247    4.018   +4.324    2.9  0.66   4.4    0.7  0.46   1.4
NEW SOURCE            269.901  -26.597    3.588   -1.472    1.5  0.32   4.5    0.0  0.00   0.0
NEW SOURCE            269.602  -26.458    3.575   -1.171    1.3  0.31   4.2    0.0  0.00   0.0