INTEGRAL Galactic bulge Monitoring
Revolution 1859: Observation start 2017-09-06T22:16 = MJD 58002.928
Total Observation GTI = 9491 seconds
IBIS/ISGRI
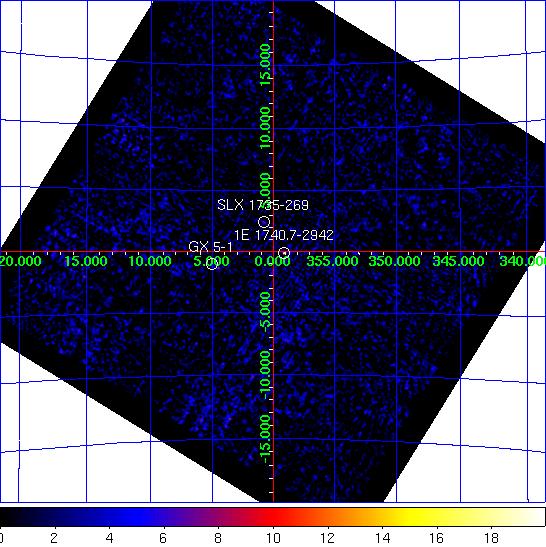
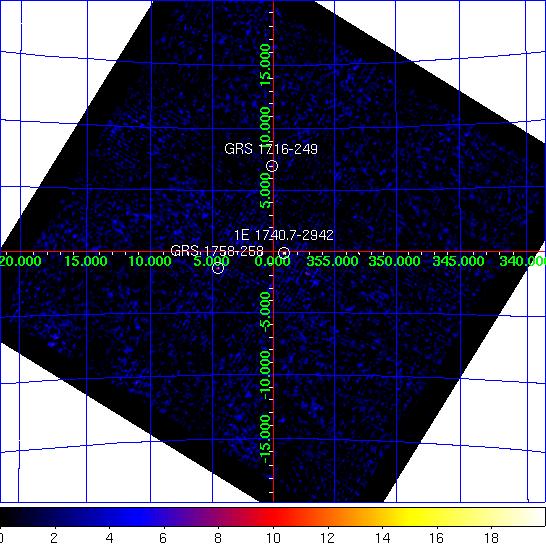
IBIS/ISGRI significance mosaic images. Left: IBIS/ISGRI 18-40 keV. Right: 40-100 keV
Sources detected > 10σ in each band are marked on the image. The table below lists the fitted position, and statistical positional uncertainty in arcmin returned by the mosaic step of
OSA10.1, of all the sources detected in the 18 - 40 keV range (band A: 1 Crab ~ 208 cps ) and 40 - 100 keV range (band B: 1 Crab ~ 100 cps ) where available.NOTES: The table is constructed from the
isgri_mosa_res.fits file - fluxes in the mosaic output are known to be systematically ~10% lower than in the ScW light-curves (see known issues). The systematic noise increases towards the edge of the field of view and NEW SOURCEs < 6σ towards the border of the image may be spurious. IBIS/ISGRI Detected Sources 18-40 keV (A) and 40-100 keV (B)
Source Name             RA       dec   +/-    l        b     A(cps)  +/-   sig  B(cps)  +/-   sig
==================== ========  ======= === ======== ======== ====== ===== ===== ====== ===== =====
1E 1740.7-2942        265.980  -29.744 1.3  359.118   -0.107   20.5  0.92  22.2    9.9  0.45  22.1
GX 5-1                270.296  -25.118 2.1    5.048   -1.047   15.1  1.17  12.9    0.0  0.00   0.0
GRS 1758-258          270.298  -25.722 0.0    4.525   -1.348   11.7  0.00   9.8    6.8  0.54  12.7
SLX 1735-269          264.574  -27.004 2.6    0.789   +2.393    9.6  0.95  10.2    0.0  0.00   0.0
4U 1700-377           256.052  -37.850 3.2  347.781   +2.129   17.1  2.12   8.1    0.0  0.00   0.0
GX 17+2               273.988  -14.031 0.0   16.429   +1.295   45.3  0.00   7.3    0.0  0.00   0.0
GX 354-0              262.969  -33.816 3.5  354.309   -0.126    8.4  1.15   7.3    0.0  0.00   0.0
IGR J18135-1751       273.265  -17.789 4.0   12.794   +0.111   12.6  0.00   6.2    0.0  0.00   0.0
GRS 1716-249          259.930  -24.968 3.3    0.196   +6.999    9.6  1.22   7.9    5.6  0.55  10.2
IGR J17597-2201       269.880  -21.995 4.3    7.570   +0.835    6.8  1.17   5.8    0.0  0.00   0.0
1A 1743-288           266.873  -28.859 4.8    0.279   -0.310    4.4  0.86   5.1    0.0  0.00   0.0
GX 9+1                270.318  -20.624 4.6    8.964   +1.161    7.4  1.37   5.4    0.0  0.00   0.0
QSO B1730-130         263.222  -13.084 4.5   12.008  +10.842   80.1  0.00   5.6    0.0  0.00   0.0
H 1820-303            275.973  -30.407 0.0    2.768   -7.976    7.4  0.00   5.4    0.0  0.00   0.0
IGR J17494-3030       267.264  -30.491 5.3  359.056   -1.444    4.5  0.96   4.6    0.0  0.00   0.0
IGR J17473-2721       266.870  -27.393 3.9    1.532   +0.451    5.7  0.88   6.5    0.0  0.00   0.0
XTE J1739-285         264.902  -28.422 4.8  359.743   +1.392    4.6  0.00   5.2    0.0  0.00   0.0
IGR J16493-4348       252.274  -43.813 4.1  341.339   +0.636  134.1 21.58   6.2    0.0  0.00   0.0
4U 1722-30            262.015  -30.756 0.0  356.419   +2.233    5.0  0.00   5.0    0.0  0.00   0.0
IGR J17419-2802       265.557  -28.095 5.1    0.326   +1.075    4.2  0.00   4.9    0.0  0.00   0.0
SAX J1750.8-2900      267.531  -28.989 5.3    0.464   -0.870    4.1  0.00   4.6    0.0  0.00   0.0
IGR J17464-3213       266.520  -32.202 0.0  357.262   -1.784    5.1  0.00   4.5    4.5  0.50   8.9
XB 1733-30            264.068  -30.468 4.7  357.626   +0.910    5.4  1.01   5.3    0.0  0.00   0.0
JEM-X
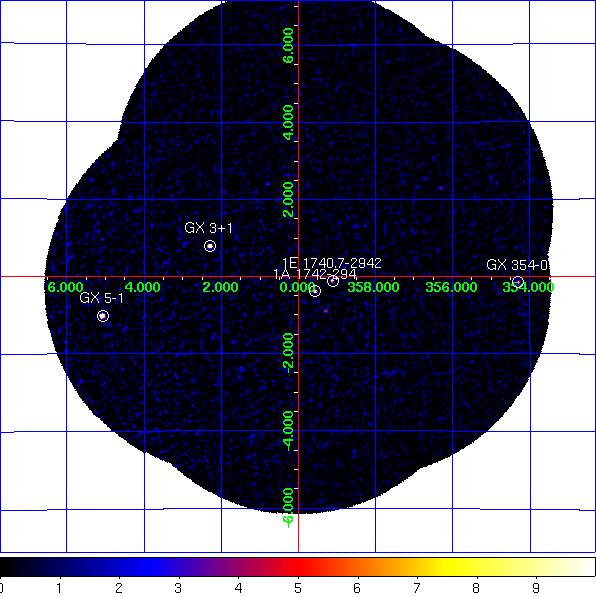

JEM-X1+2 combined significance mosaic images. Left: 3-10 keV. Right: 10-25 keV.
Sources labelled were detected in the 3-10 keV image > 6σ. The sources detected above 3σ in the 3-10 keV and/or 10-25 keV band are listed in the table below. Fluxes are extracted at the known catalogue position of the source (i.e. no fitting of the source position is done), with
mosaic_spec, in two bands: A = 3-10 keV (1 Crab ~ 97 cps [J1], 103 cps [J2]); B = 10-25 keV (1 Crab ~ 29 cps [J1], 27 cps [J2]). NOTES: The object marked as SLX 1744-299_300 is used to indicate two low-mass x-ray binaries separated by 2.7 arcminutes, SLX 1744-299 and SLX 1744-300; the position for SLX 1744-299 is used, although it can not be ruled out that SLX 1744-300 may dominate the emission some of the time. The systematic noise increases towards the edge of the field of view and in the vicinity of very bright sources, such as GX 5-1;
NEW SOURCEs < 6σ towards the border of the image and/or near GX 5-1 may, therefore, be spurious.
JEM-X1+2 Detected Sources in 3-10 keV (A) and 10-25 keV (B).
Source Name             RA       dec      l        b     A(cps)  +/-   sig  B(cps)  +/-   sig
==================== ========  ======= ======== ======== ====== ===== ===== ====== ===== =====
1A 1742-294           266.523  -29.515  359.559   -0.389    2.7  0.23  11.9    0.3  0.21   1.2
1E 1740.7-2942        265.978  -29.745  359.116   -0.106    2.2  0.22   9.7    0.6  0.21   2.8
4U 1722-30            261.888  -30.802  356.320   +2.298    1.4  0.39   3.5    0.0  0.00   0.0
GX 3+1                266.983  -26.564    2.294   +0.794    7.2  0.30  23.7    0.0  0.00   0.0
GX 354-0              262.989  -33.835  354.302   -0.150    6.6  0.87   7.6    0.0  0.00   0.0
GX 5-1                270.284  -25.079    5.077   -1.019   29.0  0.91  31.8    0.0  0.00   0.0
SLX 1735-269          264.571  -26.994    0.796   +2.400    0.9  0.27   3.1    0.0  0.00   0.0
SLX 1744-299_300      266.858  -29.999  359.297   -0.889    1.3  0.23   5.3    0.0  0.00   0.0
NEW SOURCE            269.602  -28.878    1.476   -2.378    1.2  0.37   3.1    0.0  0.00   0.0