INTEGRAL Galactic bulge Monitoring
Revolution 1849: Observation start 2017-08-10T11:25 = MJD 57975.476
Total Observation GTI = 26855 seconds
IBIS/ISGRI
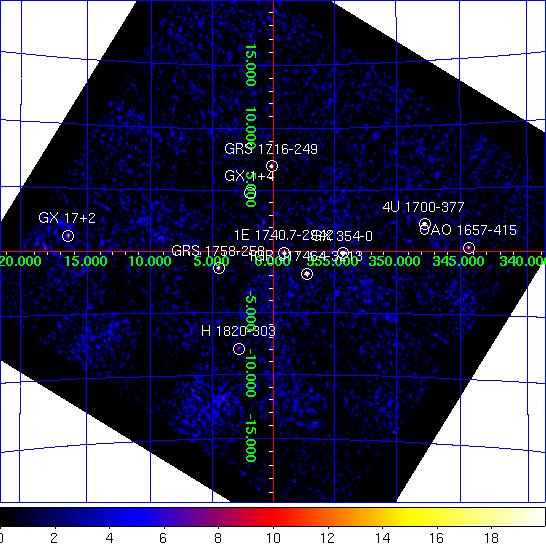
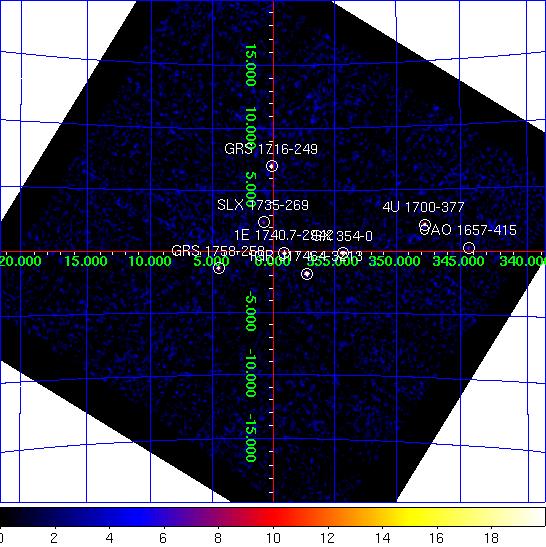
IBIS/ISGRI significance mosaic images. Left: IBIS/ISGRI 18-40 keV. Right: 40-100 keV
Sources detected > 10σ in each band are marked on the image. The table below lists the fitted position, and statistical positional uncertainty in arcmin returned by the mosaic step of
OSA10.1, of all the sources detected in the 18 - 40 keV range (band A: 1 Crab ~ 208 cps ) and 40 - 100 keV range (band B: 1 Crab ~ 100 cps ) where available.NOTES: The table is constructed from the
isgri_mosa_res.fits file - fluxes in the mosaic output are known to be systematically ~10% lower than in the ScW light-curves (see known issues). The systematic noise increases towards the edge of the field of view and NEW SOURCEs < 6σ towards the border of the image may be spurious. IBIS/ISGRI Detected Sources 18-40 keV (A) and 40-100 keV (B)
Source Name             RA       dec   +/-    l        b     A(cps)  +/-   sig  B(cps)  +/-   sig
==================== ========  ======= === ======== ======== ====== ===== ===== ====== ===== =====
IGR J17464-3213       266.565  -32.234 0.5  357.255   -1.833   38.9  0.44  88.7   16.3  0.20  80.9
GX 354-0              262.980  -33.835 0.6  354.298   -0.144   35.9  0.58  62.1    9.6  0.25  38.2
1E 1740.7-2942        265.985  -29.744 0.7  359.120   -0.110   20.1  0.44  45.6   10.7  0.21  52.0
GRS 1716-249          259.897  -25.027 0.8    0.131   +6.990   23.1  0.55  42.0   11.1  0.24  46.9
4U 1700-377           255.978  -37.837 0.8  347.756   +2.183   42.0  1.01  41.8   10.9  0.42  25.9
GRS 1758-258          270.299  -25.739 0.9    4.510   -1.357   17.0  0.49  34.9    7.5  0.22  34.8
OAO 1657-415          255.197  -41.670 1.5  344.355   +0.315   43.8  2.35  18.7    9.1  0.91  10.0
GX 17+2               274.029  -14.037 1.9   16.442   +1.258   35.0  2.42  14.5    0.0  0.00   0.0
H 1820-303            275.937  -30.329 2.4    2.824   -7.913    7.1  0.65  11.0    0.0  0.00   0.0
GX 5-1                270.341  -25.056 2.9    5.123   -1.052    4.1  0.45   9.0    0.0  0.00   0.0
GX 1+4                263.020  -24.728 2.3    1.957   +4.796    5.2  0.46  11.4    0.0  0.00   0.0
SLX 1735-269          264.545  -26.957 3.2    0.814   +2.440    3.7  0.46   8.1    2.1  0.21  10.3
1A 1743-288           266.715  -28.865 3.2    0.202   -0.195    3.6  0.45   8.0    1.2  0.21   5.6
GX 9+1                270.491  -20.498 3.7    9.153   +1.082    4.3  0.62   7.0    0.0  0.00   0.0
MXB 1730-335          263.381  -33.396 0.0  354.848   -0.184    3.7  0.00   7.0    0.0  0.00   0.0
3A 1822-371           276.469  -37.017 4.1  356.940  -11.270    5.8  0.94   6.2    0.0  0.00   0.0
SAX J1712.6-3739      258.251  -37.669 3.6  348.965   +0.842    6.3  0.90   7.0    2.0  0.37   5.3
XTE J1812-182         273.109  -18.113 3.9   12.439   +0.085    5.4  0.82   6.6    0.0  0.00   0.0
PKS 1830-211          278.311  -21.090 4.3   12.095   -5.637    5.7  0.00   5.8    0.0  0.00   0.0
GX 349+2              256.442  -36.525 4.5  349.026   +2.683    5.0  0.91   5.5    0.0  0.00   0.0
SLX 1746-331          267.452  -33.123 5.1  356.878   -2.931    2.3  0.48   4.8    0.0  0.00   0.0
IGR J17200-3116       260.004  -31.370 5.4  354.941   +3.313    2.5  0.55   4.5    0.0  0.00   0.0
XTE J1752-223         268.064  -22.326 5.6    6.438   +2.121    2.3  0.52   4.4    0.0  0.00   0.0
JEM-X

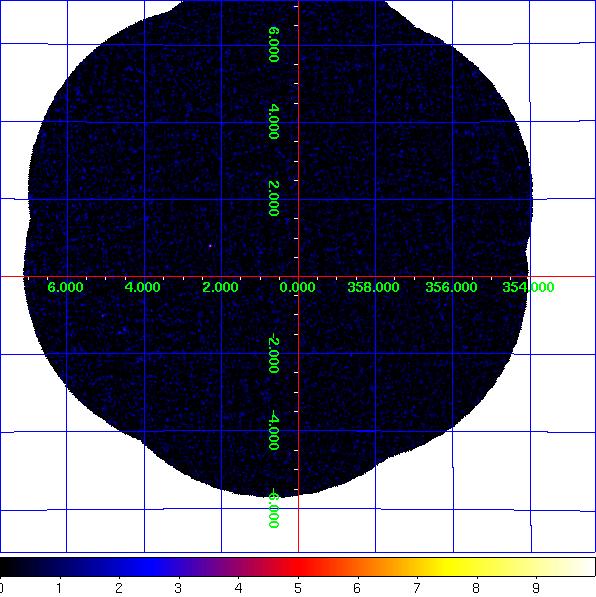
JEM-X1+2 combined significance mosaic images. Left: 3-10 keV. Right: 10-25 keV.
Sources labelled were detected in the 3-10 keV image > 6σ. The sources detected above 3σ in the 3-10 keV and/or 10-25 keV band are listed in the table below. Fluxes are extracted at the known catalogue position of the source (i.e. no fitting of the source position is done), with
mosaic_spec, in two bands: A = 3-10 keV (1 Crab ~ 97 cps [J1], 103 cps [J2]); B = 10-25 keV (1 Crab ~ 29 cps [J1], 27 cps [J2]). NOTES: The object marked as SLX 1744-299_300 is used to indicate two low-mass x-ray binaries separated by 2.7 arcminutes, SLX 1744-299 and SLX 1744-300; the position for SLX 1744-299 is used, although it can not be ruled out that SLX 1744-300 may dominate the emission some of the time. The systematic noise increases towards the edge of the field of view and in the vicinity of very bright sources, such as GX 5-1;
NEW SOURCEs < 6σ towards the border of the image and/or near GX 5-1 may, therefore, be spurious.
JEM-X1+2 Detected Sources in 3-10 keV (A) and 10-25 keV (B).
Source Name             RA       dec      l        b     A(cps)  +/-   sig  B(cps)  +/-   sig
==================== ========  ======= ======== ======== ====== ===== ===== ====== ===== =====
1A 1742-294           266.530  -29.511  359.566   -0.392    0.9  0.15   5.9    0.0  0.00   0.0
1E 1740.7-2942        265.992  -29.742  359.125   -0.114    0.6  0.14   4.1    0.0  0.00   0.0
GX 3+1                266.986  -26.558    2.299   +0.795    5.6  0.17  33.0    0.7  0.14   4.6
GX 5-1                270.286  -25.078    5.079   -1.019   78.1  1.43  54.7    2.0  0.80   2.5
IGR J17464-3213       266.570  -32.228  357.262   -1.834    1.3  0.32   4.0    0.0  0.00   0.0
MXB 1730-335          263.350  -33.388  354.841   -0.158    5.7  0.78   7.3    0.0  0.00   0.0
SLX 1735-269          264.571  -26.994    0.796   +2.400    0.5  0.14   3.6    0.0  0.00   0.0
GRS 1716-249          259.908  -25.010    0.151   +6.992    5.0  0.99   5.1    1.6  0.97   1.6
NEW SOURCE            270.365  -25.279    4.940   -1.180    4.6  1.19   3.9    0.0  0.00   0.0
NEW SOURCE            266.105  -22.074    5.720   +3.807    5.0  1.31   3.8    0.0  0.00   0.0
NEW SOURCE            265.717  -22.220    5.408   +4.037    4.3  1.13   3.8    0.0  0.00   0.0
IGR J17536-2339       268.456  -23.659    5.472   +1.134    3.4  1.04   3.3    0.0  0.00   0.0