INTEGRAL Galactic bulge Monitoring
Revolution 1793: Observation start 2017-03-14T11:21 = MJD 57826.473
Total Observation GTI = 12494 seconds
IBIS/ISGRI
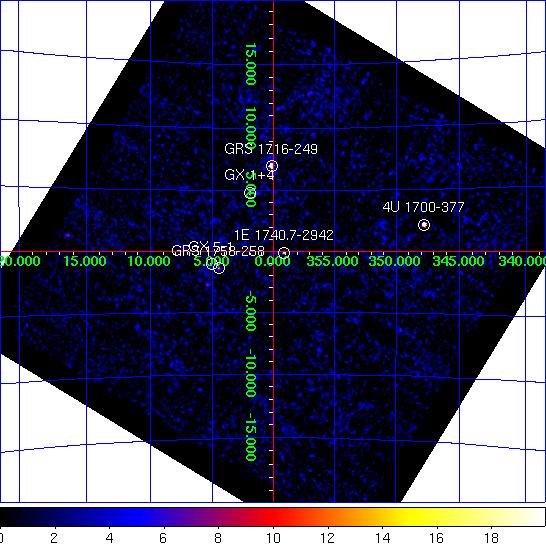
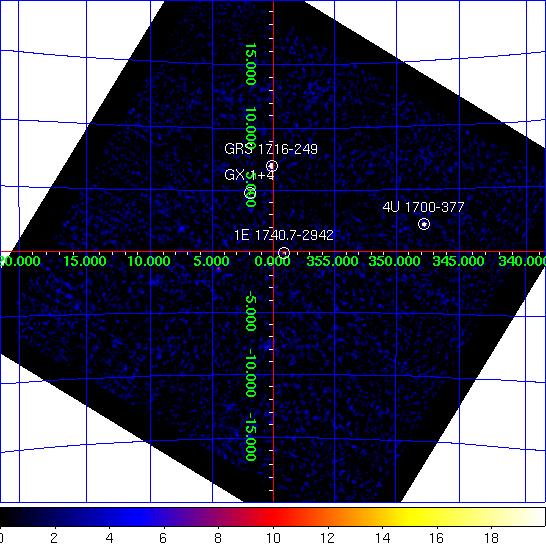
IBIS/ISGRI significance mosaic images. Left: IBIS/ISGRI 18-40 keV. Right: 40-100 keV
Sources detected > 10σ in each band are marked on the image. The table below lists the fitted position, and statistical positional uncertainty in arcmin returned by the mosaic step of
OSA10.1, of all the sources detected in the 18 - 40 keV range (band A: 1 Crab ~ 208 cps ) and 40 - 100 keV range (band B: 1 Crab ~ 100 cps ) where available.NOTES: The table is constructed from the
isgri_mosa_res.fits file - fluxes in the mosaic output are known to be systematically ~10% lower than in the ScW light-curves (see known issues). The systematic noise increases towards the edge of the field of view and NEW SOURCEs < 6σ towards the border of the image may be spurious. IBIS/ISGRI Detected Sources 18-40 keV (A) and 40-100 keV (B)
Source Name             RA       dec   +/-    l        b     A(cps)  +/-   sig  B(cps)  +/-   sig
==================== ========  ======= === ======== ======== ====== ===== ===== ====== ===== =====
GRS 1716-249          259.905  -25.015 0.3    0.145   +6.991  122.2  0.77 158.6   62.5  0.37 168.1
4U 1700-377           255.988  -37.848 0.6  347.752   +2.170   82.0  1.22  67.0   21.7  0.58  37.3
GX 1+4                263.006  -24.748 0.7    1.933   +4.796   34.9  0.63  55.0    0.0  0.00   0.0
1E 1740.7-2942        265.989  -29.733 1.3  359.131   -0.107   11.5  0.53  21.7    4.5  0.28  16.1
GX 5-1                270.297  -25.078 1.6    5.084   -1.028   11.4  0.65  17.4    0.0  0.00   0.0
GRS 1758-258          270.308  -25.782 2.0    4.477   -1.385    8.6  0.63  13.6    3.2  0.32  10.0
GX 17+2               274.002  -14.068 2.9   16.402   +1.266   63.1  6.98   9.0    0.0  0.00   0.0
IGR J17454-2919       266.293  -29.342 0.0  359.603   -0.128    4.1  0.00   7.6    0.0  0.00   0.0
SLX 1735-269          264.512  -27.035 4.5    0.733   +2.423    3.9  0.69   5.6    2.0  0.34   6.0
H 1702-429            256.546  -42.987 3.6  343.918   -1.279   19.1  2.68   7.1    6.8  1.33   5.1
GX 3+1                266.938  -26.546 0.0    2.288   +0.837    3.3  0.00   5.3    0.0  0.00   0.0
1A 1743-288           266.857  -28.930 0.0    0.211   -0.335    2.9  0.00   5.0    0.0  0.00   0.0
Oph Cluster           258.141  -23.337 4.4    0.614   +9.270    5.7  0.99   5.7    0.0  0.00   0.0
1RXS J165443.5-19162  262.617  -19.293 5.0    6.357   +8.047    5.9  0.00   5.0    0.0  0.00   0.0
H 1820-303            275.949  -30.340 4.3    2.819   -7.927    5.1  0.86   5.9    0.0  0.00   0.0
SLX 1746-331          267.570  -33.175 4.5  356.883   -3.043    3.3  0.60   5.6    0.0  0.00   0.0
IGR J17445-2747       266.015  -27.778 0.0    0.808   +0.897    3.2  0.00   4.6    0.0  0.00   0.0
3A 1822-371           276.339  -37.117 4.4  356.802  -11.220    6.3  1.10   5.7    0.0  0.00   0.0
MAXI J1807-228        271.915  -22.833 4.6    7.766   -1.215    4.4  0.81   5.4    0.0  0.00   0.0
GX 9+1                270.348  -20.507 5.9    9.078   +1.194    4.2  1.01   4.1    0.0  0.00   0.0
2S 1711-339           258.601  -34.048 5.0  352.068   +2.732    3.9  0.79   5.0    0.0  0.00   0.0
1RXS J174607.8-21333  266.528  -21.483 6.2    6.430   +3.777    3.0  0.76   3.9    0.0  0.00   0.0
GX 354-0              263.031  -33.814 0.0  354.338   -0.168    2.4  0.00   4.1    0.0  0.00   0.0
GX 13+1               273.584  -17.068 5.9   13.573   +0.189    7.7  0.00   4.1    0.0  0.00   0.0
Swift J174540.7-2900  266.387  -28.930 0.0  359.997   +0.016    2.3  0.00   4.0    0.0  0.00   0.0
JEM-X
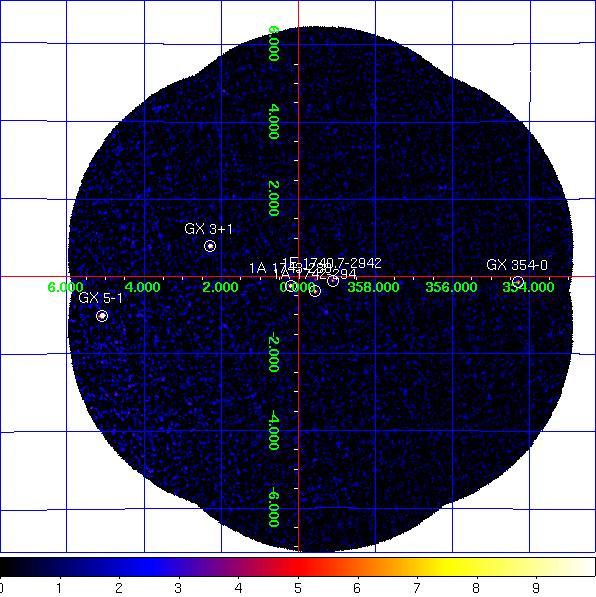
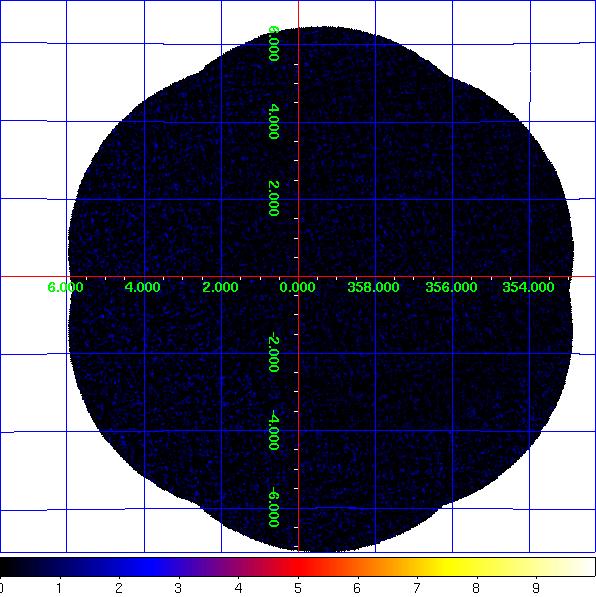
JEM-X1+2 combined significance mosaic images. Left: 3-10 keV. Right: 10-25 keV.
Sources labelled were detected in the 3-10 keV image > 6σ. The sources detected above 3σ in the 3-10 keV and/or 10-25 keV band are listed in the table below. Fluxes are extracted at the known catalogue position of the source (i.e. no fitting of the source position is done), with
mosaic_spec, in two bands: A = 3-10 keV (1 Crab ~ 97 cps [J1], 103 cps [J2]); B = 10-25 keV (1 Crab ~ 29 cps [J1], 27 cps [J2]). NOTES: The object marked as SLX 1744-299_300 is used to indicate two low-mass x-ray binaries separated by 2.7 arcminutes, SLX 1744-299 and SLX 1744-300; the position for SLX 1744-299 is used, although it can not be ruled out that SLX 1744-300 may dominate the emission some of the time. The systematic noise increases towards the edge of the field of view and in the vicinity of very bright sources, such as GX 5-1;
NEW SOURCEs < 6σ towards the border of the image and/or near GX 5-1 may, therefore, be spurious.
JEM-X1+2 Detected Sources in 3-10 keV (A) and 10-25 keV (B).
Source Name             RA       dec      l        b     A(cps)  +/-   sig  B(cps)  +/-   sig
==================== ========  ======= ======== ======== ====== ===== ===== ====== ===== =====
1A 1742-294           266.523  -29.515  359.559   -0.389    2.0  0.19  10.4    0.0  0.00   0.0
1A 1743-288           266.759  -28.894    0.197   -0.243    3.2  0.20  16.2    0.0  0.00   0.0
1E 1740.7-2942        265.978  -29.745  359.116   -0.106    1.2  0.19   6.3    0.0  0.00   0.0
4U 1722-30            261.888  -30.802  356.320   +2.298    1.0  0.32   3.0    0.0  0.00   0.0
GX 1+4                263.009  -24.746    1.937   +4.795    2.8  0.88   3.2    0.0  0.00   0.0
GX 3+1                266.989  -26.561    2.299   +0.790    9.6  0.32  29.9    0.0  0.00   0.0
GX 354-0              262.989  -33.835  354.302   -0.150    5.3  0.53   9.9    0.0  0.00   0.0
GX 5-1                270.282  -25.077    5.078   -1.016   64.0  1.43  44.9    1.3  0.77   1.7
SLX 1744-299_300      266.858  -29.999  359.297   -0.889    0.6  0.19   3.2    0.0  0.00   0.0
KS 1741-293           266.212  -29.351  359.559   -0.072    0.9  0.19   4.7    0.0  0.00   0.0
NEW SOURCE            272.065  -26.375    4.731   -3.052    7.2  1.78   4.1    1.2  1.03   1.2
NEW SOURCE            270.746  -25.729    4.718   -1.702    4.1  1.14   3.6    0.0  0.00   0.0
NEW SOURCE            271.664  -26.587    4.372   -2.841    4.8  1.21   4.0    0.0  0.00   0.0
NEW SOURCE            273.023  -26.785    4.783   -4.000    9.5  2.40   4.0    0.0  0.00   0.0
NEW SOURCE            271.266  -28.157    2.826   -3.295    1.9  0.54   3.6    0.0  0.00   0.0