INTEGRAL Galactic bulge Monitoring
Revolution 1783: Observation start 2017-02-15T21:14 = MJD 57799.885
Total Observation GTI = 12538 seconds
IBIS/ISGRI
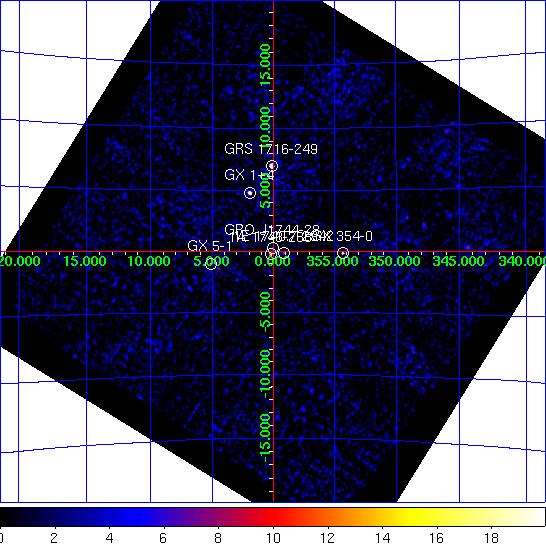
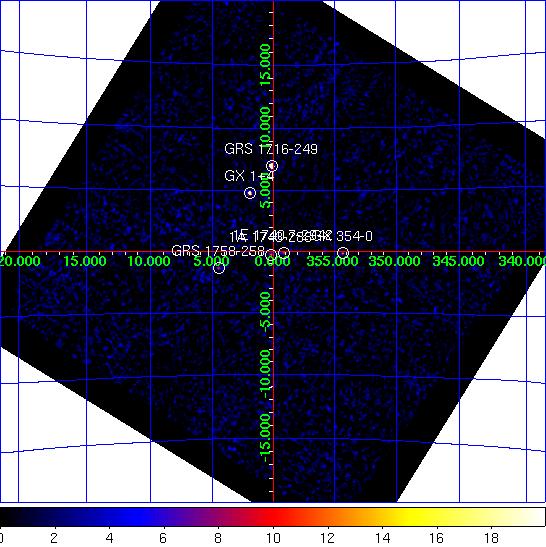
IBIS/ISGRI significance mosaic images. Left: IBIS/ISGRI 18-40 keV. Right: 40-100 keV
Sources detected > 10σ in each band are marked on the image. The table below lists the fitted position, and statistical positional uncertainty in arcmin returned by the mosaic step of
OSA10.1, of all the sources detected in the 18 - 40 keV range (band A: 1 Crab ~ 208 cps ) and 40 - 100 keV range (band B: 1 Crab ~ 100 cps ) where available.NOTES: The table is constructed from the
isgri_mosa_res.fits file - fluxes in the mosaic output are known to be systematically ~10% lower than in the ScW light-curves (see known issues). The systematic noise increases towards the edge of the field of view and NEW SOURCEs < 6σ towards the border of the image may be spurious. IBIS/ISGRI Detected Sources 18-40 keV (A) and 40-100 keV (B)
Source Name             RA       dec   +/-    l        b     A(cps)  +/-   sig  B(cps)  +/-   sig
==================== ========  ======= === ======== ======== ====== ===== ===== ====== ===== =====
GRS 1716-249          259.905  -25.022 0.3    0.140   +6.988  132.9  0.75 177.5   69.4  0.37 189.5
GX 1+4                263.002  -24.744 0.7    1.935   +4.801   34.9  0.64  54.7    0.0  0.00   0.0
GX 354-0              262.965  -33.839 1.4  354.288   -0.136   13.5  0.64  21.2    4.0  0.32  12.4
1A 1743-288           266.735  -28.867 1.5    0.209   -0.211   12.1  0.63  19.1    4.2  0.32  13.1
GX 5-1                270.261  -25.058 1.7    5.085   -0.990   11.4  0.68  16.7    0.0  0.00   0.0
1E 1740.7-2942        266.002  -29.771 2.3  359.105   -0.137    7.1  0.60  11.7    3.4  0.31  10.9
GRO J1744-28          266.127  -28.781 0.0    0.005   +0.289    6.5  0.00  10.3    0.0  0.00   0.0
OAO 1657-415          255.176  -41.684 2.8  344.334   +0.319   18.8  2.04   9.2    0.0  0.00   0.0
GRS 1758-258          270.331  -25.757 2.7    4.509   -1.391    6.9  0.70   9.8    3.7  0.34  11.0
GX 349+2              256.447  -36.387 3.4  349.138   +2.763    8.3  1.09   7.6    0.0  0.00   0.0
4U 1700-377           256.070  -37.875 2.9  347.770   +2.102   11.0  1.20   9.2    2.9  0.58   5.0
3A 1822-371           276.424  -37.113 3.6  356.836  -11.279    9.3  1.32   7.0    0.0  0.00   0.0
IGR J17454-2919       266.293  -29.356 4.6  359.591   -0.135    3.3  0.61   5.4    0.0  0.00   0.0
GX 9+1                270.350  -20.457 4.2    9.123   +1.218    5.8  0.97   6.0    0.0  0.00   0.0
SAX J1712.6-3739      258.217  -37.600 4.9  349.005   +0.905    5.5  1.09   5.0    0.0  0.00   0.0
IGR J17177-3656       259.337  -36.953 4.6  350.050   +0.558    5.1  0.00   5.4    0.0  0.00   0.0
SAX J1806.5-2215      271.526  -22.291 3.6    8.065   -0.637    5.8  0.83   7.0    0.0  0.00   0.0
IGR J17454-2703       266.312  -26.957 4.8    1.646   +1.102    3.3  0.63   5.2    0.0  0.00   0.0
4U 1722-30            261.838  -30.915 4.4  356.202   +2.271    4.2  0.73   5.7    0.0  0.00   0.0
IGR J17204-3554       260.105  -35.963 4.9  351.215   +0.621    4.5  0.89   5.1    0.0  0.00   0.0
GRO J1750-27          267.400  -26.681 5.8    2.385   +0.414    2.9  0.70   4.2    0.0  0.00   0.0
JEM-X
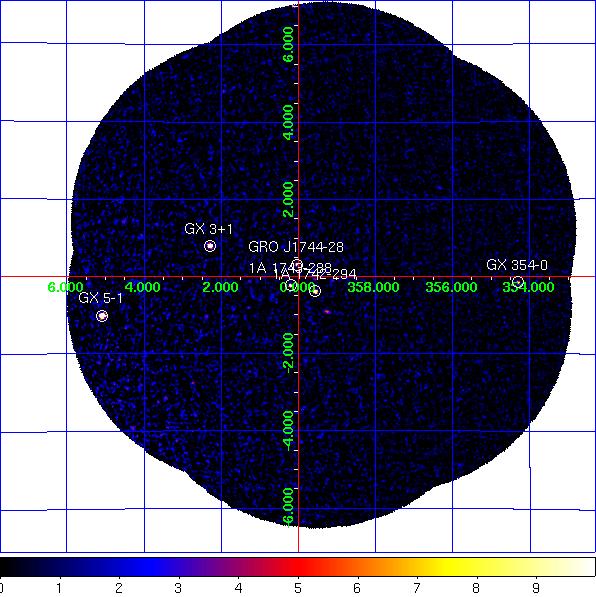
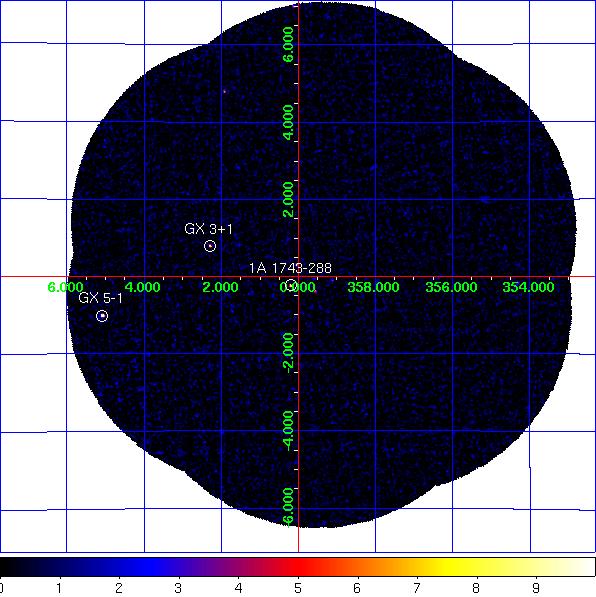
JEM-X1+2 combined significance mosaic images. Left: 3-10 keV. Right: 10-25 keV.
Sources labelled were detected in the 3-10 keV image > 6σ. The sources detected above 3σ in the 3-10 keV and/or 10-25 keV band are listed in the table below. Fluxes are extracted at the known catalogue position of the source (i.e. no fitting of the source position is done), with
mosaic_spec, in two bands: A = 3-10 keV (1 Crab ~ 97 cps [J1], 103 cps [J2]); B = 10-25 keV (1 Crab ~ 29 cps [J1], 27 cps [J2]). NOTES: The object marked as SLX 1744-299_300 is used to indicate two low-mass x-ray binaries separated by 2.7 arcminutes, SLX 1744-299 and SLX 1744-300; the position for SLX 1744-299 is used, although it can not be ruled out that SLX 1744-300 may dominate the emission some of the time. The systematic noise increases towards the edge of the field of view and in the vicinity of very bright sources, such as GX 5-1;
NEW SOURCEs < 6σ towards the border of the image and/or near GX 5-1 may, therefore, be spurious.
JEM-X1+2 Detected Sources in 3-10 keV (A) and 10-25 keV (B).
Source Name             RA       dec      l        b     A(cps)  +/-   sig  B(cps)  +/-   sig
==================== ========  ======= ======== ======== ====== ===== ===== ====== ===== =====
1A 1742-294           266.523  -29.515  359.559   -0.389    5.7  0.25  23.3    0.8  0.17   4.8
1A 1743-288           266.745  -28.887    0.197   -0.229    2.9  0.26  11.5    1.2  0.17   7.1
1E 1740.7-2942        265.978  -29.745  359.116   -0.106    0.8  0.23   3.5    0.6  0.16   3.4
GX 1+4                263.009  -24.746    1.937   +4.795    2.8  0.79   3.6    2.7  0.57   4.7
GX 3+1                266.988  -26.568    2.292   +0.788   15.6  0.39  40.1    1.8  0.24   7.6
GX 354-0              262.989  -33.835  354.302   -0.150    5.8  0.66   8.8    2.2  0.56   3.9
GX 5-1                270.284  -25.079    5.077   -1.019  118.3  1.90  62.3   15.2  1.01  15.1
SLX 1744-299_300      266.858  -29.999  359.297   -0.889    1.3  0.25   5.3    0.0  0.00   0.0
GRO J1744-28          266.136  -28.732    0.051   +0.308    1.9  0.24   8.1    0.9  0.17   5.6
NEW SOURCE            272.689  -27.178    4.295   -3.926   13.8  2.77   5.0    0.0  0.00   0.0
NEW SOURCE            271.466  -27.546    3.447   -3.152    4.2  0.98   4.3    0.0  0.00   0.0
NEW SOURCE            267.662  -24.332    4.524   +1.416    4.5  1.01   4.5    0.8  0.62   1.2