INTEGRAL Galactic bulge Monitoring
Revolution 1741: Observation start 2016-10-27T06:28 = MJD 57688.27
Total Observation GTI = 4832 seconds
IBIS/ISGRI

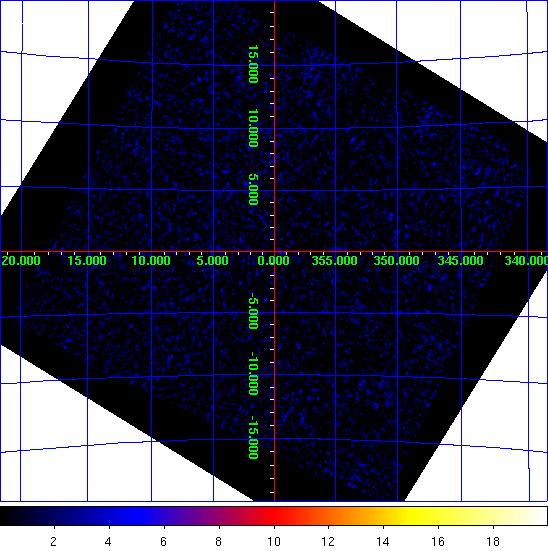
IBIS/ISGRI significance mosaic images. Left: IBIS/ISGRI 18-40 keV. Right: 40-100 keV
Sources detected > 10σ in each band are marked on the image. The table below lists the fitted position, and statistical positional uncertainty in arcmin returned by the mosaic step of
OSA10.1, of all the sources detected in the 18 - 40 keV range (band A: 1 Crab ~ 208 cps ) and 40 - 100 keV range (band B: 1 Crab ~ 100 cps ) where available.NOTES: The table is constructed from the
isgri_mosa_res.fits file - fluxes in the mosaic output are known to be systematically ~10% lower than in the ScW light-curves (see known issues). The systematic noise increases towards the edge of the field of view and NEW SOURCEs < 6σ towards the border of the image may be spurious. IBIS/ISGRI Detected Sources 18-40 keV (A) and 40-100 keV (B)
Source Name             RA       dec   +/-    l        b     A(cps)  +/-   sig  B(cps)  +/-   sig
==================== ========  ======= === ======== ======== ====== ===== ===== ====== ===== =====
GX 1+4                263.028  -24.756 2.0    1.937   +4.775   11.7  0.84  13.9    0.0  0.00   0.0
GX 5-1                270.309  -25.120 2.9    5.053   -1.058    7.5  0.84   8.9    0.0  0.00   0.0
KS 1741-293           266.169  -29.368 3.2  359.525   -0.050    5.9  0.73   8.0    2.3  0.42   5.6
AX J1820.5-1434       275.210  -14.630 3.9   16.462   -0.031   27.8  0.00   6.5    0.0  0.00   0.0
1E 1740.7-2942        265.976  -29.776 0.0  359.089   -0.120    4.3  0.00   5.5    3.0  0.00   6.6
JEM-X

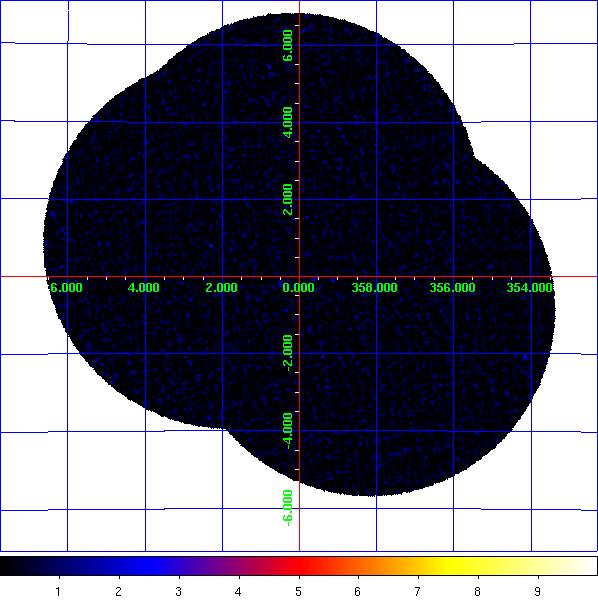
JEM-X1+2 combined significance mosaic images. Left: 3-10 keV. Right: 10-25 keV.
Sources labelled were detected in the 3-10 keV image > 6σ. The sources detected above 3σ in the 3-10 keV and/or 10-25 keV band are listed in the table below. Fluxes are extracted at the known catalogue position of the source (i.e. no fitting of the source position is done), with
mosaic_spec, in two bands: A = 3-10 keV (1 Crab ~ 97 cps [J1], 103 cps [J2]); B = 10-25 keV (1 Crab ~ 29 cps [J1], 27 cps [J2]). NOTES: The object marked as SLX 1744-299_300 is used to indicate two low-mass x-ray binaries separated by 2.7 arcminutes, SLX 1744-299 and SLX 1744-300; the position for SLX 1744-299 is used, although it can not be ruled out that SLX 1744-300 may dominate the emission some of the time. The systematic noise increases towards the edge of the field of view and in the vicinity of very bright sources, such as GX 5-1;
NEW SOURCEs < 6σ towards the border of the image and/or near GX 5-1 may, therefore, be spurious.
JEM-X1+2 Detected Sources in 3-10 keV (A) and 10-25 keV (B).
Source Name             RA       dec      l        b     A(cps)  +/-   sig  B(cps)  +/-   sig
==================== ========  ======= ======== ======== ====== ===== ===== ====== ===== =====
1A 1742-294           266.523  -29.515  359.559   -0.389    3.6  0.38   9.7    0.3  0.24   1.2
GX 3+1                266.983  -26.564    2.294   +0.794   14.9  0.39  38.0    0.6  0.22   2.5
GX 5-1                270.294  -25.076    5.085   -1.024   46.5  1.57  29.6    0.0  0.00   0.0
NEW SOURCE            268.430  -30.700  359.389   -2.414    3.8  0.59   6.5    0.0  0.00   0.0
SLX 1735-269          264.571  -26.994    0.796   +2.400    2.3  0.33   6.8    0.3  0.22   1.3
KS 1741-293           266.203  -29.339  359.564   -0.059    2.0  0.36   5.6    0.5  0.22   2.1
NEW SOURCE            264.879  -35.003  354.159   -2.093   17.2  1.73   9.9    4.3  1.36   3.2