INTEGRAL Galactic bulge Monitoring
Revolution 1718: Observation start 1999-12-31T23:58 = MJD 51544
Total Observation GTI = 9083 seconds
IBIS/ISGRI
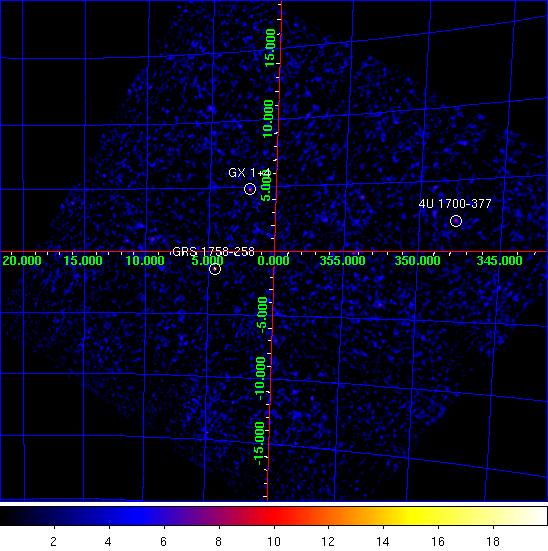
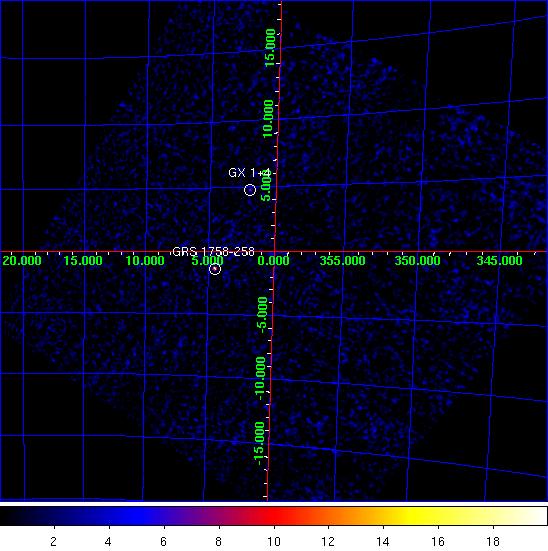
IBIS/ISGRI significance mosaic images. Left: IBIS/ISGRI 18-40 keV. Right: 40-100 keV
Sources detected > 10σ in each band are marked on the image. The table below lists the fitted position, and statistical positional uncertainty in arcmin returned by the mosaic step of
OSA10.1, of all the sources detected in the 18 - 40 keV range (band A: 1 Crab ~ 208 cps ) and 40 - 100 keV range (band B: 1 Crab ~ 100 cps ) where available.NOTES: The table is constructed from the
isgri_mosa_res.fits file - fluxes in the mosaic output are known to be systematically ~10% lower than in the ScW light-curves (see known issues). The systematic noise increases towards the edge of the field of view and NEW SOURCEs < 6σ towards the border of the image may be spurious. IBIS/ISGRI Detected Sources 18-40 keV (A) and 40-100 keV (B)
Source Name             RA       dec   +/-    l        b     A(cps)  +/-   sig  B(cps)  +/-   sig
==================== ========  ======= === ======== ======== ====== ===== ===== ====== ===== =====
GRS 1758-258          270.321  -25.756 1.3    4.505   -1.383   12.9  0.57  22.7    6.7  0.33  20.3
GX 1+4                262.985  -24.720 2.0    1.946   +4.827    9.3  0.68  13.6    0.0  0.00   0.0
4U 1700-377           255.956  -37.884 2.6  347.708   +2.169   12.7  1.26  10.1    3.2  0.67   4.8
GX 354-0              262.905  -33.856 3.1  354.246   -0.104    5.6  0.66   8.5    0.0  0.00   0.0
IGR J18027-2016       270.750  -20.270 3.5    9.472   +0.983    5.9  0.81   7.3    0.0  0.00   0.0
3A 1822-371           276.433  -37.086 2.9  356.863  -11.274    9.7  1.09   8.9    2.6  0.58   4.5
GX 349+2              256.447  -36.469 3.1  349.072   +2.713   10.7  1.31   8.2    0.0  0.00   0.0
GX 5-1                270.292  -25.080 0.0    5.080   -1.025    4.7  0.00   7.0    0.0  0.00   0.0
V1223 Sgr             283.793  -31.169 4.0    4.964  -14.383   20.9  3.34   6.3    0.0  0.00   0.0
4U 1722-30            261.799  -30.757 0.0  356.314   +2.387    3.9  0.00   6.5    0.0  0.00   0.0
GX 9+1                270.449  -20.606 0.0    9.039   +1.063    4.8  0.00   5.4    0.0  0.00   0.0
1A 1743-288           266.700  -28.926 5.2    0.143   -0.215    2.4  0.51   4.8    1.3  0.30   4.5
AX J1749.2-2725       267.273  -27.340 6.7    1.762   +0.172    1.9  0.53   3.6    0.0  0.00   0.0
IGR J17285-2922       262.205  -29.325 0.0  357.703   +2.887    2.9  0.00   4.9    0.0  0.00   0.0
IGR J17454-2703       266.423  -27.097 0.0    1.579   +0.944    2.5  0.00   4.7    0.0  0.00   0.0
1RXS J182129.0-13164  275.389  -13.300 5.5   17.717   +0.442   22.9  0.00   4.5    0.0  0.00   0.0
IGR J17586-2129       269.708  -21.463 5.4    7.952   +1.238    3.6  0.79   4.6    0.0  0.00   0.0
NEW SOURCE            258.610  -31.826 2.8  353.882   +4.020    6.7  0.73   9.2    0.0  0.00   0.0
NEW SOURCE            265.696  -37.505 0.0  352.378   -3.972    6.7  0.00   7.9    0.0  0.00   0.0
NEW SOURCE            259.221  -18.723 0.0    5.060  +11.047    8.9  0.00   7.7    0.0  0.00   0.0
NEW SOURCE            271.920  -18.519 3.7   11.538   +0.878    6.9  0.96   6.8    0.0  0.00   0.0
NEW SOURCE            254.733  -35.332 3.1  349.128   +4.507   10.0  1.19   8.4    0.0  0.00   0.0
NEW SOURCE            253.446  -20.026 3.6    0.743  +14.744   15.9  2.22   7.2    0.0  0.00   0.0
NEW SOURCE            273.310  -32.637 3.6  359.719   -6.984    4.8  0.64   7.1    0.0  0.00   0.0
NEW SOURCE            255.626  -25.029 3.2  357.861  +10.143    9.5  1.16   8.2    0.0  0.00   0.0
NEW SOURCE            259.164  -21.311 3.6    2.850   +9.642    6.6  0.93   7.0    0.0  0.00   0.0
NEW SOURCE            270.279  -18.830 3.6   10.505   +2.080    6.4  0.91   7.1    0.0  0.00   0.0
NEW SOURCE            258.752  -42.915 3.5  344.933   -2.536   18.4  2.48   7.4    0.0  0.00   0.0
NEW SOURCE            283.401  -29.551 4.5    6.353  -13.427   16.3  3.18   5.6    0.0  0.00   0.0
NEW SOURCE            260.675  -19.980 4.6    4.768   +9.208    5.0  0.93   5.4    0.0  0.00   0.0
NEW SOURCE            277.130  -26.176 3.6    7.040   -6.973    6.0  0.87   7.1    0.0  0.00   0.0
NEW SOURCE            252.265  -30.212 4.2  351.855   +9.322   10.0  1.48   6.0    0.0  0.00   0.0
NEW SOURCE            276.668  -35.779 3.6  358.147  -10.879    6.5  0.93   7.0    0.0  0.00   0.0
NEW SOURCE            250.644  -34.668 3.3  347.510   +7.519   23.5  2.68   7.8    0.0  0.00   0.0
NEW SOURCE            269.923  -20.078 3.5    9.254   +1.753    6.3  0.85   7.3    0.0  0.00   0.0
NEW SOURCE            280.210  -32.071 3.8    2.845  -11.961    8.3  1.20   6.7    0.0  0.00   0.0
NEW SOURCE            266.277  -41.244 4.1  349.401   -6.294    9.8  1.45   6.1    0.0  0.00   0.0
NEW SOURCE            270.973  -31.659 4.3  359.635   -4.778    3.5  0.57   5.8    0.0  0.00   0.0
NEW SOURCE            263.588  -36.410 3.7  352.408   -1.963    5.7  0.82   6.8    0.0  0.00   0.0
NEW SOURCE            264.083  -32.710 3.7  355.743   -0.308    4.0  0.58   6.8    0.0  0.00   0.0
NEW SOURCE            272.608  -20.235 0.0   10.352   -0.521    4.9  0.00   6.1    0.0  0.00   0.0
NEW SOURCE            258.817  -17.429 4.2    5.940  +12.085    9.2  1.55   6.0    0.0  0.00   0.0
NEW SOURCE            263.631  -25.859 4.2    1.302   +3.720    4.0  0.67   5.9    0.0  0.00   0.0
NEW SOURCE            270.444  -30.591 4.3    0.348   -3.861    3.1  0.56   5.9    0.0  0.00   0.0
NEW SOURCE            272.613  -22.178 0.0    8.651   -1.462    4.3  0.00   6.0    0.0  0.00   0.0
NEW SOURCE            254.846  -26.074 3.8  356.583  +10.081    7.7  1.16   6.6    0.0  0.00   0.0
NEW SOURCE            268.172  -14.325 3.7   13.415   +6.074   17.3  2.54   6.8    0.0  0.00   0.0
JEM-X
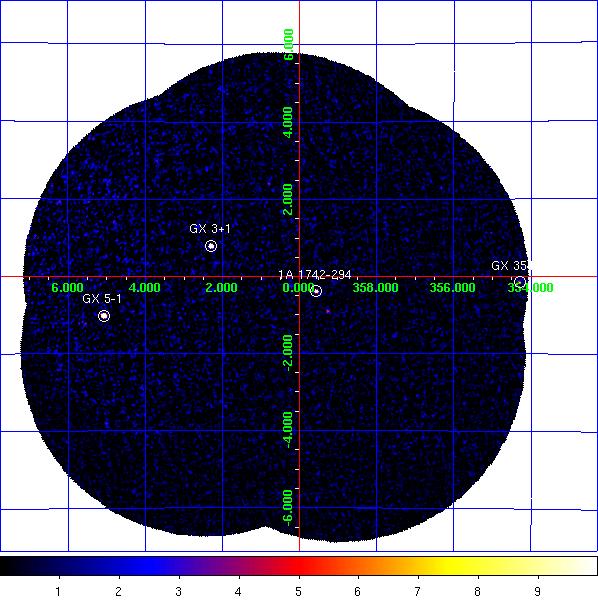
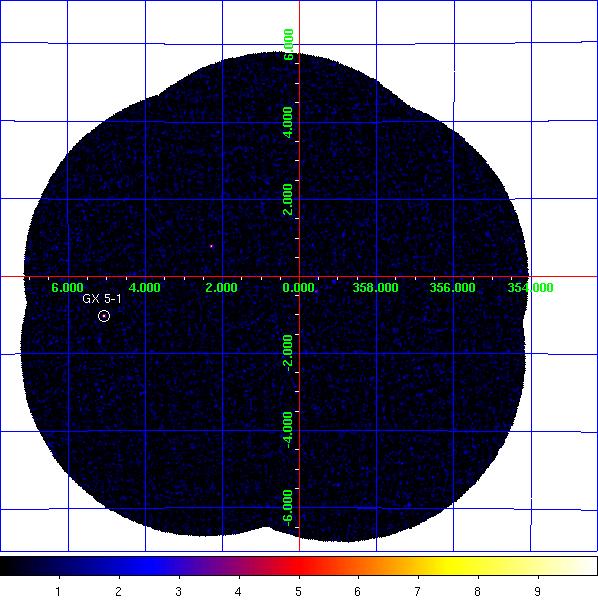
JEM-X1+2 combined significance mosaic images. Left: 3-10 keV. Right: 10-25 keV.
Sources labelled were detected in the 3-10 keV image > 6σ. The sources detected above 3σ in the 3-10 keV and/or 10-25 keV band are listed in the table below. Fluxes are extracted at the known catalogue position of the source (i.e. no fitting of the source position is done), with
mosaic_spec, in two bands: A = 3-10 keV (1 Crab ~ 97 cps [J1], 103 cps [J2]); B = 10-25 keV (1 Crab ~ 29 cps [J1], 27 cps [J2]). NOTES: The object marked as SLX 1744-299_300 is used to indicate two low-mass x-ray binaries separated by 2.7 arcminutes, SLX 1744-299 and SLX 1744-300; the position for SLX 1744-299 is used, although it can not be ruled out that SLX 1744-300 may dominate the emission some of the time. The systematic noise increases towards the edge of the field of view and in the vicinity of very bright sources, such as GX 5-1;
NEW SOURCEs < 6σ towards the border of the image and/or near GX 5-1 may, therefore, be spurious.
JEM-X1+2 Detected Sources in 3-10 keV (A) and 10-25 keV (B).
Source Name             RA       dec      l        b     A(cps)  +/-   sig  B(cps)  +/-   sig
==================== ========  ======= ======== ======== ====== ===== ===== ====== ===== =====
1A 1742-294           266.523  -29.515  359.559   -0.389    3.9  0.24  16.4    0.6  0.14   4.1
GX 3+1                266.985  -26.561    2.297   +0.794   14.6  0.35  42.0    1.0  0.18   5.4
GX 354-0              262.989  -33.835  354.302   -0.150   13.6  2.01   6.8    3.7  1.66   2.2
GX 5-1                270.289  -25.077    5.081   -1.021   54.3  1.02  53.3    3.7  0.48   7.7
SLX 1735-269          264.571  -26.994    0.796   +2.400    1.3  0.39   3.5    0.2  0.23   1.0
SLX 1744-299_300      266.858  -29.999  359.297   -0.889    1.0  0.24   4.1    0.0  0.00   0.0
NEW SOURCE            268.122  -22.610    6.220   +1.931   10.0  2.39   4.2    0.0  0.00   0.0