INTEGRAL Galactic bulge Monitoring
Revolution 1594: Observation start 2015-10-04T06:31 = MJD 57299.272
Total Observation GTI = 11829 seconds
IBIS/ISGRI

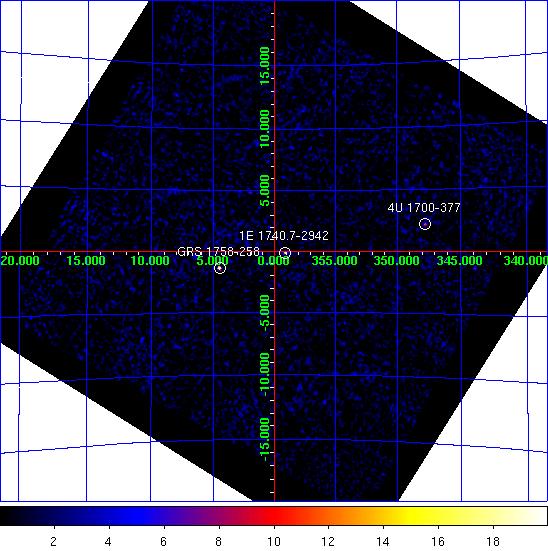
IBIS/ISGRI significance mosaic images. Left: IBIS/ISGRI 18-40 keV. Right: 40-100 keV
Sources detected > 10σ in each band are marked on the image. The table below lists the fitted position, and statistical positional uncertainty in arcmin returned by the mosaic step of
OSA10.1, of all the sources detected in the 18 - 40 keV range (band A: 1 Crab ~ 208 cps ) and 40 - 100 keV range (band B: 1 Crab ~ 100 cps ) where available.NOTES: The table is constructed from the
isgri_mosa_res.fits file - fluxes in the mosaic output are known to be systematically ~10% lower than in the ScW light-curves (see known issues). The systematic noise increases towards the edge of the field of view and NEW SOURCEs < 6σ towards the border of the image may be spurious. IBIS/ISGRI Detected Sources 18-40 keV (A) and 40-100 keV (B)
Source Name             RA       dec   +/-    l        b     A(cps)  +/-   sig  B(cps)  +/-   sig
==================== ========  ======= === ======== ======== ====== ===== ===== ====== ===== =====
GRS 1758-258          270.268  -25.753 1.0    4.484   -1.339   13.3  0.44  30.0    8.9  0.28  32.4
1E 1740.7-2942        265.985  -29.743 1.7  359.121   -0.109    6.8  0.42  16.4    4.5  0.27  16.7
4U 1700-377           255.969  -37.845 1.7  347.746   +2.184   13.5  0.79  17.1    5.5  0.47  11.6
GX 5-1                270.254  -25.100 1.9    5.045   -1.005    6.7  0.46  14.4    0.0  0.00   0.0
GX 349+2              256.420  -36.394 2.3  349.119   +2.776    7.9  0.67  11.8    0.0  0.00   0.0
GX 1+4                263.025  -24.733 2.2    1.956   +4.789    5.2  0.42  12.4    0.0  0.00   0.0
GX 354-0              262.989  -33.814 2.8  354.320   -0.139    4.0  0.43   9.4    0.0  0.00   0.0
3A 1822-371           276.456  -37.124 3.0  356.837  -11.307    8.4  0.97   8.7    0.0  0.00   0.0
QSO B1730-130         263.235  -13.185 3.5   11.928  +10.779   20.2  2.78   7.3    0.0  0.00   0.0
GX 17+2               273.985  -14.035 3.5   16.424   +1.296   26.0  3.51   7.4    0.0  0.00   0.0
H 1702-429            256.613  -43.094 4.2  343.862   -1.382   14.7  2.44   6.0   11.0  1.38   8.0
V745 Sco              268.753  -33.156 4.1  357.402   -3.887    2.8  0.00   6.2    0.0  0.00   0.0
H 1820-303            275.860  -30.360 4.3    2.766   -7.868    3.9  0.67   5.8    0.0  0.00   0.0
GX 3+1                267.030  -26.472 3.7    2.394   +0.805    2.5  0.37   6.8    0.0  0.00   0.0
GX 9+1                270.396  -20.632 4.1    8.993   +1.094    3.5  0.57   6.1    0.0  0.00   0.0
SLX 1744-299_300      266.933  -30.015 5.6  359.317   -0.953    1.7  0.39   4.4    0.0  0.00   0.0
MAXI J1828-249        277.230  -25.065 4.7    8.078   -6.551    4.5  0.00   5.3    0.0  0.00   0.0
SLX 1735-269          264.546  -27.005 4.7    0.775   +2.414    2.2  0.41   5.2    1.1  0.27   4.2
NEW SOURCE            263.851  -33.104 3.4  355.306   -0.356    3.1  0.42   7.5    0.0  0.00   0.0
NEW SOURCE            254.161  -14.286 4.4    6.002  +17.555   15.7  2.50   5.7    0.0  0.00   0.0
NEW SOURCE            260.084  -17.404 3.3    6.642  +11.092    5.9  0.74   7.9    0.0  0.00   0.0
NEW SOURCE            273.606  -32.495 3.8  359.963   -7.138    3.6  0.55   6.7    0.0  0.00   0.0
NEW SOURCE            271.005  -17.974 4.3   11.590   +1.902    4.9  0.80   5.9    0.0  0.00   0.0
NEW SOURCE            275.405  -14.596 0.0   16.580   -0.182   15.9  0.00   6.1    0.0  0.00   0.0
NEW SOURCE            272.250  -36.159 4.1  356.168   -7.860    3.7  0.61   6.1    0.0  0.00   0.0
NEW SOURCE            253.202  -14.708 4.6    5.076  +18.070   13.5  2.42   5.4    0.0  0.00   0.0
JEM-X
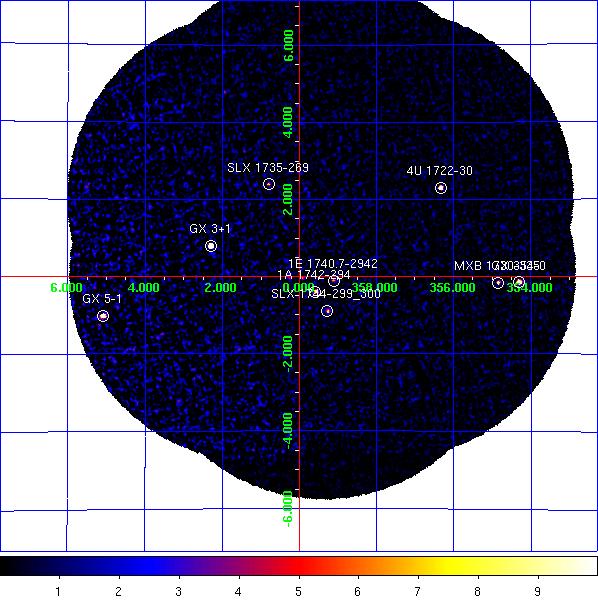
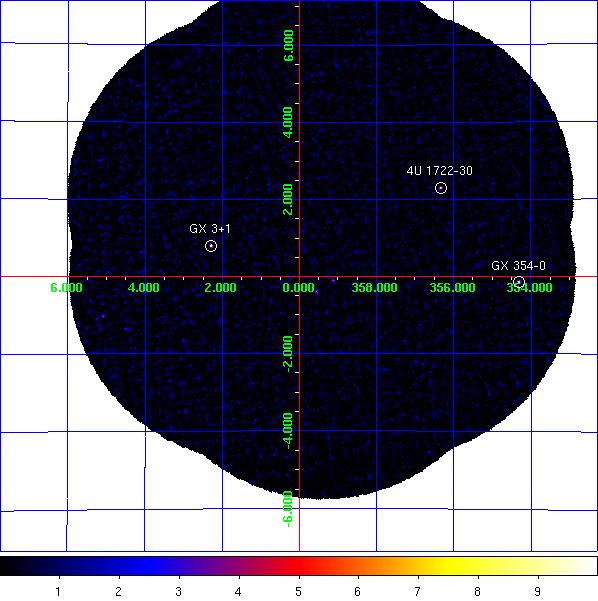
JEM-X1+2 combined significance mosaic images. Left: 3-10 keV. Right: 10-25 keV.
Sources labelled were detected in the 3-10 keV image > 6σ. The sources detected above 3σ in the 3-10 keV and/or 10-25 keV band are listed in the table below. Fluxes are extracted at the known catalogue position of the source (i.e. no fitting of the source position is done), with
mosaic_spec, in two bands: A = 3-10 keV (1 Crab ~ 97 cps [J1], 103 cps [J2]); B = 10-25 keV (1 Crab ~ 29 cps [J1], 27 cps [J2]). NOTES: The object marked as SLX 1744-299_300 is used to indicate two low-mass x-ray binaries separated by 2.7 arcminutes, SLX 1744-299 and SLX 1744-300; the position for SLX 1744-299 is used, although it can not be ruled out that SLX 1744-300 may dominate the emission some of the time. The systematic noise increases towards the edge of the field of view and in the vicinity of very bright sources, such as GX 5-1;
NEW SOURCEs < 6σ towards the border of the image and/or near GX 5-1 may, therefore, be spurious.
JEM-X1+2 Detected Sources in 3-10 keV (A) and 10-25 keV (B).
Source Name             RA       dec      l        b     A(cps)  +/-   sig  B(cps)  +/-   sig
==================== ========  ======= ======== ======== ====== ===== ===== ====== ===== =====
1A 1742-294           266.543  -29.489  359.590   -0.391    4.5  0.27  16.6    0.6  0.16   4.0
1E 1740.7-2942        265.978  -29.745  359.116   -0.106    1.8  0.25   7.1    0.7  0.15   4.5
1E 1743.1-2843        266.587  -28.729    0.260   -0.029    1.2  0.26   4.8    0.3  0.15   1.7
4U 1722-30            261.888  -30.802  356.320   +2.298   11.4  0.35  32.6    1.5  0.22   6.9
GX 1+4                263.009  -24.746    1.937   +4.795    1.7  0.44   3.9    0.6  0.30   1.9
GX 3+1                266.983  -26.564    2.294   +0.794   27.3  0.35  77.3    1.8  0.18   9.8
GX 354-0              262.989  -33.835  354.302   -0.150   28.5  0.86  33.2    4.6  0.52   8.9
GX 5-1                270.284  -25.079    5.077   -1.019   87.7  2.28  38.4    4.4  1.14   3.9
MXB 1730-335          263.350  -33.388  354.841   -0.158    7.3  0.60  12.1    0.0  0.00   0.0
SLX 1735-269          264.571  -26.994    0.796   +2.400    1.7  0.23   7.5    0.3  0.14   1.9
SLX 1744-299_300      266.858  -29.999  359.297   -0.889    2.4  0.30   8.1    0.3  0.17   1.5
Swift J174535.5-2901  266.398  -29.026  359.920   -0.042    1.3  0.25   5.4    0.0  0.00   0.0