INTEGRAL Galactic bulge Monitoring
Revolution 1589: Observation start 2015-09-19T18:30 = MJD 57284.772
Total Observation GTI = 12524 seconds
IBIS/ISGRI

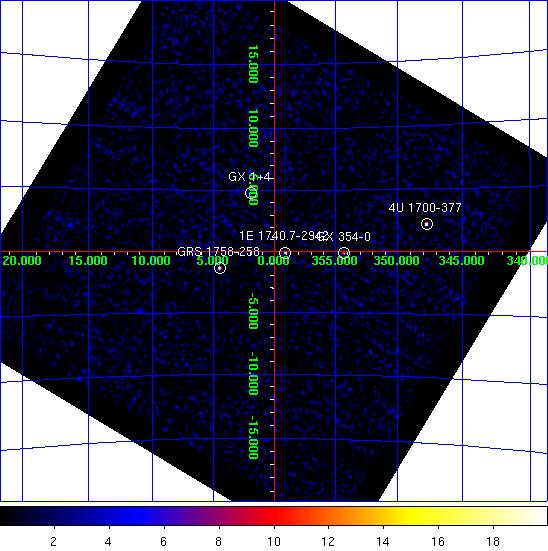
IBIS/ISGRI significance mosaic images. Left: IBIS/ISGRI 18-40 keV. Right: 40-100 keV
Sources detected > 10σ in each band are marked on the image. The table below lists the fitted position, and statistical positional uncertainty in arcmin returned by the mosaic step of
OSA10.1, of all the sources detected in the 18 - 40 keV range (band A: 1 Crab ~ 208 cps ) and 40 - 100 keV range (band B: 1 Crab ~ 100 cps ) where available.NOTES: The table is constructed from the
isgri_mosa_res.fits file - fluxes in the mosaic output are known to be systematically ~10% lower than in the ScW light-curves (see known issues). The systematic noise increases towards the edge of the field of view and NEW SOURCEs < 6σ towards the border of the image may be spurious. IBIS/ISGRI Detected Sources 18-40 keV (A) and 40-100 keV (B)
Source Name             RA       dec   +/-    l        b     A(cps)  +/-   sig  B(cps)  +/-   sig
==================== ========  ======= === ======== ======== ====== ===== ===== ====== ===== =====
4U 1700-377           255.981  -37.849 0.7  347.748   +2.174   45.8  1.00  45.8   15.4  0.59  26.1
GX 354-0              262.992  -33.844 1.0  354.295   -0.157   15.3  0.49  31.1    5.0  0.30  16.5
GRS 1758-258          270.288  -25.740 1.0    4.505   -1.349   13.8  0.46  30.1   10.2  0.29  35.3
GX 1+4                263.022  -24.757 1.6    1.934   +4.779    7.6  0.42  18.2    0.0  0.00   0.0
1E 1740.7-2942        265.976  -29.723 2.0  359.134   -0.093    5.8  0.43  13.4    5.3  0.28  18.8
GX 349+2              256.438  -36.438 2.2  349.093   +2.738   10.5  0.87  12.1    0.0  0.00   0.0
3A 1822-371           276.548  -37.091 3.8  356.899  -11.359    5.6  0.84   6.7    0.0  0.00   0.0
4U 1722-30            261.802  -30.825 4.1  356.259   +2.347    2.8  0.46   6.1    1.4  0.29   4.8
XTE J1817-330         274.477  -32.982 4.4  359.868   -8.013    2.8  0.50   5.7    0.0  0.00   0.0
SLX 1735-269          264.573  -27.047 4.9    0.752   +2.371    1.9  0.38   5.1    0.0  0.00   0.0
GX 3+1                266.920  -26.611 4.2    2.224   +0.818    2.3  0.39   6.0    0.0  0.00   0.0
Ginga 1826-24         277.349  -23.855 0.0    9.212   -6.099    3.2  0.00   5.1    0.0  0.00   0.0
Oph Cluster           258.041  -23.442 4.9    0.473   +9.285    3.0  0.00   5.1    0.0  0.00   0.0
GX 5-1                270.199  -25.043 4.8    5.071   -0.933    2.3  0.45   5.2    0.0  0.00   0.0
SAX J1750.8-2900      267.577  -29.047 0.0    0.435   -0.935    1.8  0.00   4.7    0.0  0.00   0.0
IGR J17098-3628       257.453  -36.401 0.0  349.611   +2.105    3.9  0.00   4.6    0.0  0.00   0.0
IGR J17497-2821       267.480  -28.306 0.0    1.027   -0.482    1.6  0.00   4.6    0.0  0.00   0.0
GX 17+2               273.957  -13.943 5.6   16.492   +1.364    7.3  1.67   4.4    0.0  0.00   0.0
H 1820-303            275.908  -30.325 5.9    2.816   -7.889    2.3  0.56   4.1    0.0  0.00   0.0
1A 1743-288           266.726  -28.886 5.2    0.189   -0.214    1.7  0.37   4.7    0.0  0.00   0.0
QSO B1730-130         263.192  -13.064 5.8   12.011  +10.878    9.0  0.00   4.2    0.0  0.00   0.0
H 1702-429            256.705  -43.006 5.8  343.973   -1.383   31.8  7.59   4.2    0.0  0.00   0.0
4U 1708-40            258.243  -40.808 6.0  346.421   -0.997    6.9  0.00   4.0    0.0  0.00   0.0
IGR J17475-2822       266.919  -28.389 0.0    0.702   -0.102    1.4  0.00   4.0    0.0  0.00   0.0
IGR J18135-1751       273.390  -17.936 6.3   12.723   -0.064    3.1  0.00   3.9    0.0  0.00   0.0
1A 1742-294           266.539  -29.622 0.0  359.475   -0.456    1.6  0.00   3.8    0.0  0.00   0.0
JEM-X
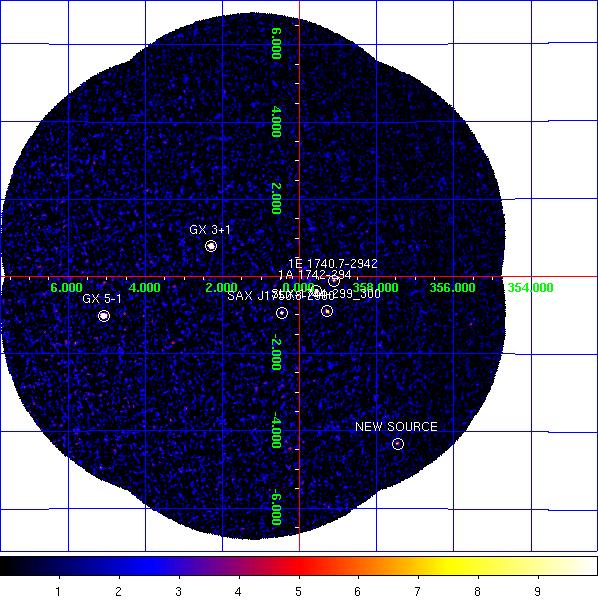
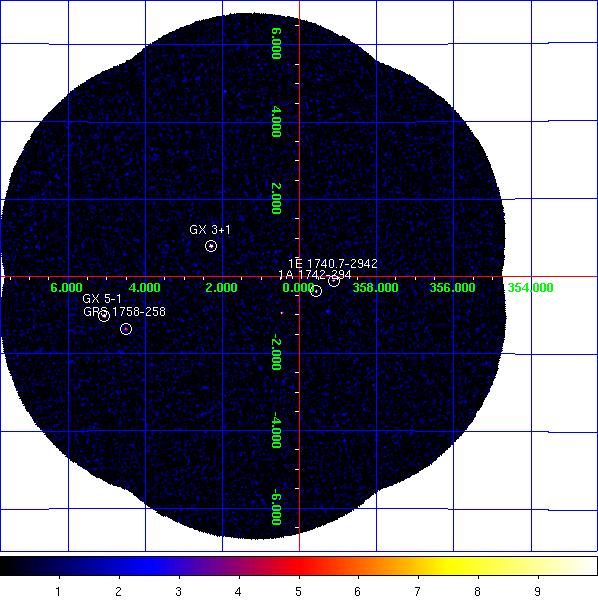
JEM-X1+2 combined significance mosaic images. Left: 3-10 keV. Right: 10-25 keV.
Sources labelled were detected in the 3-10 keV image > 6σ. The sources detected above 3σ in the 3-10 keV and/or 10-25 keV band are listed in the table below. Fluxes are extracted at the known catalogue position of the source (i.e. no fitting of the source position is done), with
mosaic_spec, in two bands: A = 3-10 keV (1 Crab ~ 97 cps [J1], 103 cps [J2]); B = 10-25 keV (1 Crab ~ 29 cps [J1], 27 cps [J2]). NOTES: The object marked as SLX 1744-299_300 is used to indicate two low-mass x-ray binaries separated by 2.7 arcminutes, SLX 1744-299 and SLX 1744-300; the position for SLX 1744-299 is used, although it can not be ruled out that SLX 1744-300 may dominate the emission some of the time. The systematic noise increases towards the edge of the field of view and in the vicinity of very bright sources, such as GX 5-1;
NEW SOURCEs < 6σ towards the border of the image and/or near GX 5-1 may, therefore, be spurious.
JEM-X1+2 Detected Sources in 3-10 keV (A) and 10-25 keV (B).
Source Name             RA       dec      l        b     A(cps)  +/-   sig  B(cps)  +/-   sig
==================== ========  ======= ======== ======== ====== ===== ===== ====== ===== =====
1A 1742-294           266.518  -29.509  359.562   -0.382    7.4  0.26  28.0    0.9  0.14   6.5
1E 1740.7-2942        265.978  -29.745  359.116   -0.106    2.6  0.29   9.1    1.0  0.16   6.2
1E 1743.1-2843        266.587  -28.729    0.260   -0.029    1.0  0.25   3.8    0.3  0.13   2.0
GRS 1741.9-2853       266.260  -28.914  359.953   +0.120    0.9  0.26   3.5    0.0  0.00   0.0
GRS 1758-258          270.303  -25.741    4.511   -1.361    1.1  0.53   2.1    1.7  0.25   6.8
GX 1+4                263.009  -24.746    1.937   +4.795    2.4  0.72   3.3    1.3  0.46   2.8
GX 3+1                266.983  -26.565    2.292   +0.793   32.3  0.32 102.0    2.7  0.15  18.2
GX 5-1                270.289  -25.076    5.082   -1.021  108.6  0.78 139.2    4.0  0.30  13.2
SLX 1744-299_300      266.858  -29.999  359.297   -0.889    2.7  0.28   9.5    0.4  0.15   2.4
SAX J1750.8-2900      267.606  -29.030    0.462   -0.948    3.1  0.26  11.8    0.6  0.14   4.5
NEW SOURCE            269.239  -33.327  357.457   -4.325    7.3  1.00   7.2    0.8  0.69   1.1