INTEGRAL Galactic bulge Monitoring
Revolution 1587: Observation start 2015-09-13T18:50 = MJD 57278.785
Total Observation GTI = 12501 seconds
IBIS/ISGRI
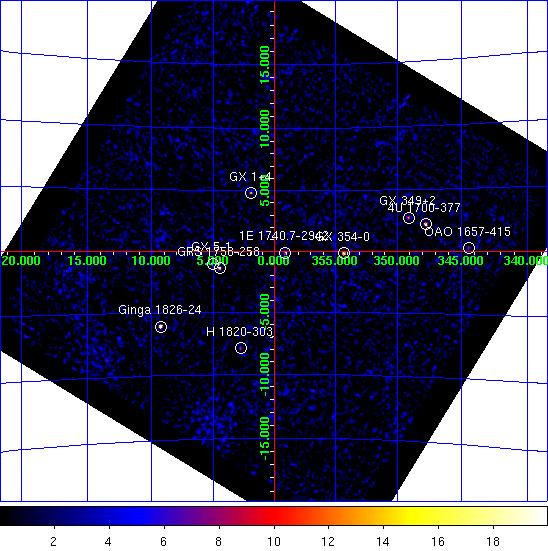
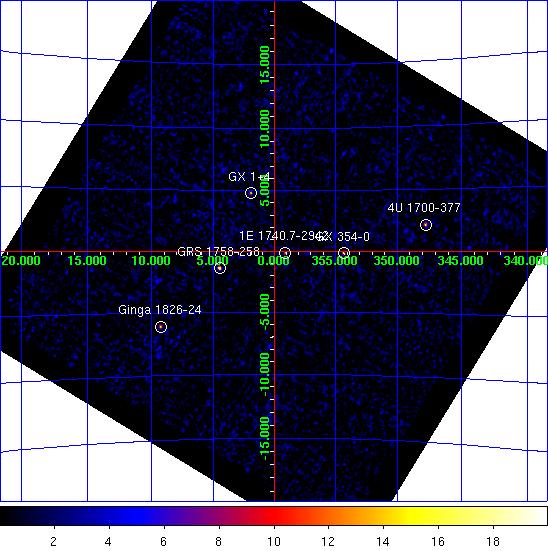
IBIS/ISGRI significance mosaic images. Left: IBIS/ISGRI 18-40 keV. Right: 40-100 keV
Sources detected > 10σ in each band are marked on the image. The table below lists the fitted position, and statistical positional uncertainty in arcmin returned by the mosaic step of
OSA10.1, of all the sources detected in the 18 - 40 keV range (band A: 1 Crab ~ 208 cps ) and 40 - 100 keV range (band B: 1 Crab ~ 100 cps ) where available.NOTES: The table is constructed from the
isgri_mosa_res.fits file - fluxes in the mosaic output are known to be systematically ~10% lower than in the ScW light-curves (see known issues). The systematic noise increases towards the edge of the field of view and NEW SOURCEs < 6σ towards the border of the image may be spurious. IBIS/ISGRI Detected Sources 18-40 keV (A) and 40-100 keV (B)
Source Name             RA       dec   +/-    l        b     A(cps)  +/-   sig  B(cps)  +/-   sig
==================== ========  ======= === ======== ======== ====== ===== ===== ====== ===== =====
Ginga 1826-24         277.358  -23.790 1.1    9.274   -6.077   20.2  0.70  28.8    6.8  0.41  16.3
GX 354-0              263.002  -33.842 1.0  354.302   -0.163   12.7  0.40  31.8    5.0  0.25  19.9
GRS 1758-258          270.311  -25.749 1.1    4.507   -1.371   12.4  0.47  26.5    8.8  0.29  30.3
GX 5-1                270.274  -25.080 1.2    5.071   -1.011   11.3  0.45  25.1    1.8  0.28   6.5
4U 1700-377           255.967  -37.855 1.2  347.736   +2.179   20.6  0.81  25.6    7.7  0.48  16.1
1E 1740.7-2942        265.958  -29.753 1.8  359.100   -0.095    5.6  0.37  15.3    4.0  0.24  16.8
GX 1+4                263.001  -24.749 1.7    1.930   +4.799    7.6  0.44  17.1    0.0  0.00   0.0
GX 349+2              256.437  -36.435 2.0  349.095   +2.740   11.1  0.79  14.0    0.0  0.00   0.0
H 1820-303            275.925  -30.356 2.2    2.795   -7.916    7.7  0.62  12.5    0.0  0.00   0.0
OAO 1657-415          255.294  -41.650 2.6  344.416   +0.270   20.0  1.97  10.2    7.7  1.17   6.6
3A 1822-371           276.464  -37.137 3.6  356.827  -11.318    6.3  0.89   7.1    0.0  0.00   0.0
4U 1722-30            261.803  -30.835 3.7  356.251   +2.341    3.0  0.44   6.8    0.0  0.00   0.0
1A 1742-294           266.496  -29.582 0.0  359.490   -0.404    2.2  0.00   6.2    0.0  0.00   0.0
H 1702-429            256.531  -43.112 5.0  343.811   -1.346   14.1  2.86   4.9    0.0  0.00   0.0
GX 17+2               274.043  -14.070 3.9   16.420   +1.230   17.5  2.72   6.4    0.0  0.00   0.0
GX 9+1                270.482  -20.542 4.5    9.111   +1.068    3.1  0.00   5.5    0.0  0.00   0.0
IGR J16558-4150       253.963  -41.882 4.8  343.618   +0.904   12.1  2.37   5.1    0.0  0.00   0.0
XTE J1720-318         259.940  -31.802 0.0  354.554   +3.111    2.3  0.00   4.6    0.0  0.00   0.0
IGR J17445-2747       266.248  -27.756 5.4    0.935   +0.733    1.7  0.36   4.6    0.0  0.00   0.0
Swift J174535.5-2901  266.329  -29.013 5.5  359.900   +0.017    1.5  0.34   4.5    0.0  0.00   0.0
V1223 Sgr             283.645  -31.116 0.0    4.963  -14.245   10.7  0.00   4.6    0.0  0.00   0.0
H1825-331             277.037  -33.101 5.5    0.733   -9.985    2.8  0.63   4.4    0.0  0.00   0.0
GX 3+1                267.091  -26.551 5.6    2.354   +0.718    1.8  0.40   4.4    0.0  0.00   0.0
GRS 1734-292          264.329  -29.155 0.0  358.855   +1.425    1.6  0.00   4.2    0.0  0.00   0.0
SAX J1753.5-2349      268.290  -23.777 5.0    5.293   +1.205    2.0  0.40   5.0    0.0  0.00   0.0
XTE J1743-363         265.872  -36.415 6.6  353.383   -3.522    2.0  0.54   3.7    0.0  0.00   0.0
JEM-X
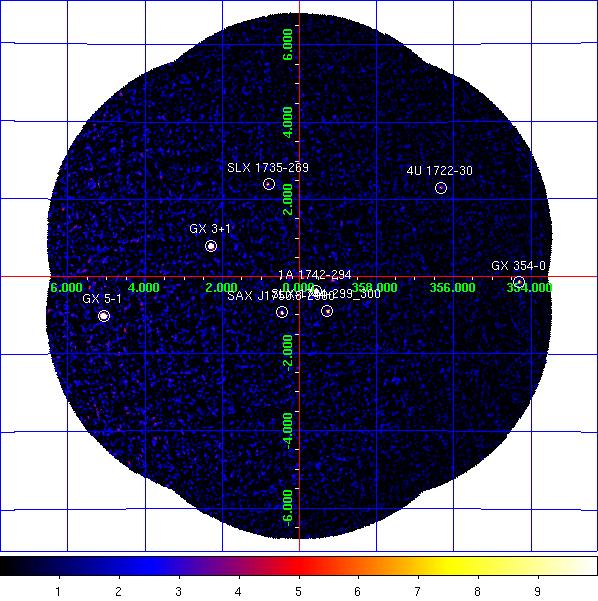
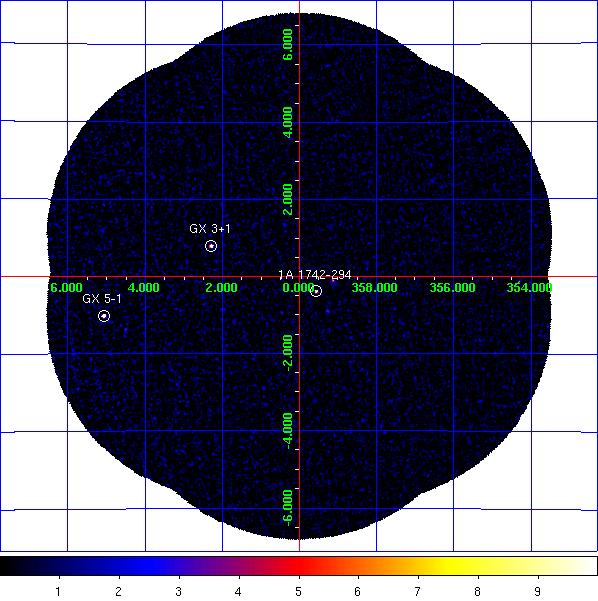
JEM-X1+2 combined significance mosaic images. Left: 3-10 keV. Right: 10-25 keV.
Sources labelled were detected in the 3-10 keV image > 6σ. The sources detected above 3σ in the 3-10 keV and/or 10-25 keV band are listed in the table below. Fluxes are extracted at the known catalogue position of the source (i.e. no fitting of the source position is done), with
mosaic_spec, in two bands: A = 3-10 keV (1 Crab ~ 97 cps [J1], 103 cps [J2]); B = 10-25 keV (1 Crab ~ 29 cps [J1], 27 cps [J2]). NOTES: The object marked as SLX 1744-299_300 is used to indicate two low-mass x-ray binaries separated by 2.7 arcminutes, SLX 1744-299 and SLX 1744-300; the position for SLX 1744-299 is used, although it can not be ruled out that SLX 1744-300 may dominate the emission some of the time. The systematic noise increases towards the edge of the field of view and in the vicinity of very bright sources, such as GX 5-1;
NEW SOURCEs < 6σ towards the border of the image and/or near GX 5-1 may, therefore, be spurious.
JEM-X1+2 Detected Sources in 3-10 keV (A) and 10-25 keV (B).
Source Name             RA       dec      l        b     A(cps)  +/-   sig  B(cps)  +/-   sig
==================== ========  ======= ======== ======== ====== ===== ===== ====== ===== =====
1A 1742-294           266.523  -29.515  359.559   -0.389   10.6  0.24  44.3    1.5  0.13  11.1
1E 1740.7-2942        265.978  -29.745  359.116   -0.106    1.3  0.23   5.8    0.7  0.13   5.2
1E 1743.1-2843        266.587  -28.729    0.260   -0.029    1.1  0.24   4.6    0.2  0.13   1.3
4U 1722-30            261.888  -30.802  356.320   +2.298    2.9  0.44   6.6    0.6  0.31   1.8
GX 3+1                266.976  -26.562    2.291   +0.800   31.0  0.37  84.1    3.3  0.19  18.0
GX 354-0              262.989  -33.835  354.302   -0.150    9.6  0.93  10.3    3.3  0.69   4.9
GX 5-1                270.286  -25.078    5.080   -1.019  144.3  1.51  95.5   17.8  0.67  26.7
SAX J1750.8-2900      267.590  -29.025    0.460   -0.934    3.2  0.26  12.4    0.3  0.14   2.1
SLX 1735-269          264.571  -26.994    0.796   +2.400    1.8  0.30   6.1    0.0  0.00   0.0
SLX 1744-299_300      266.858  -29.999  359.297   -0.889    1.5  0.23   6.6    0.4  0.13   2.8
Swift J174535.5-2901  266.398  -29.026  359.920   -0.042    0.9  0.23   3.8    0.4  0.13   2.9
NEW SOURCE            271.011  -25.906    4.681   -1.997    5.3  1.07   5.0    0.0  0.00   0.0
NEW SOURCE            269.785  -24.409    5.433   -0.292    6.9  1.40   5.0    0.0  0.00   0.0
NEW SOURCE            269.435  -24.074    5.564   +0.152    6.6  1.52   4.3    1.0  0.83   1.2