INTEGRAL Galactic bulge Monitoring
Revolution 1525: Observation start 2015-04-02T21:10 = MJD 57114.882
Total Observation GTI = 14092 seconds
IBIS/ISGRI
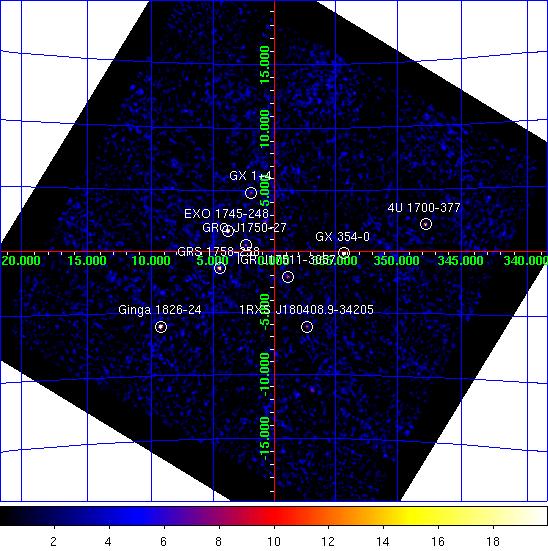
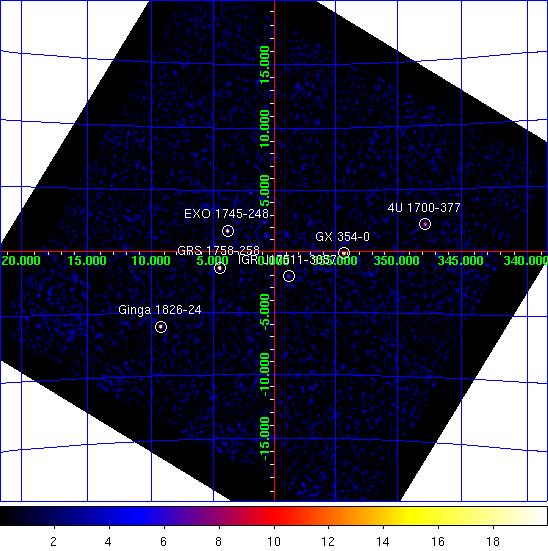
IBIS/ISGRI significance mosaic images. Left: IBIS/ISGRI 18-40 keV. Right: 40-100 keV
Sources detected > 10σ in each band are marked on the image. The table below lists the fitted position, and statistical positional uncertainty in arcmin returned by the mosaic step of
OSA10.1, of all the sources detected in the 18 - 40 keV range (band A: 1 Crab ~ 208 cps ) and 40 - 100 keV range (band B: 1 Crab ~ 100 cps ) where available.NOTES: The table is constructed from the
isgri_mosa_res.fits file - fluxes in the mosaic output are known to be systematically ~10% lower than in the ScW light-curves (see known issues). The systematic noise increases towards the edge of the field of view and NEW SOURCEs < 6σ towards the border of the image may be spurious. IBIS/ISGRI Detected Sources 18-40 keV (A) and 40-100 keV (B)
Source Name             RA       dec   +/-    l        b     A(cps)  +/-   sig  B(cps)  +/-   sig
==================== ========  ======= === ======== ======== ====== ===== ===== ====== ===== =====
GX 354-0              262.995  -33.830 0.7  354.309   -0.152   22.4  0.41  55.0    8.0  0.25  31.4
EXO 1745-248          267.022  -24.779 0.8    3.841   +1.686   16.8  0.38  43.9    6.5  0.24  27.4
GRS 1758-258          270.304  -25.736 1.1    4.515   -1.359   10.4  0.36  29.3    8.5  0.22  38.5
Ginga 1826-24         277.372  -23.794 1.0    9.277   -6.090   21.2  0.64  33.0    9.2  0.39  23.8
4U 1700-377           255.985  -37.841 1.5  347.756   +2.176   14.8  0.79  18.7    7.1  0.47  15.0
IGR J17511-3057       267.795  -30.939 2.1  358.905   -2.065    4.6  0.35  13.0    2.2  0.22  10.0
1RXS J180408.9-34205  271.053  -34.367 2.2  357.288   -6.148    5.5  0.44  12.4    0.0  0.00   0.0
GRO J1750-27          267.265  -26.640 2.4    2.359   +0.539    4.5  0.40  11.3    0.0  0.00   0.0
SLX 1735-269          264.467  -27.009 2.7    0.733   +2.471    3.1  0.32   9.7    1.4  0.21   6.7
GX 1+4                262.983  -24.749 2.4    1.922   +4.813    4.1  0.37  11.0    0.0  0.00   0.0
GX 5-1                270.278  -25.045 3.1    5.104   -0.997    3.5  0.41   8.5    0.0  0.00   0.0
3A 1822-371           276.378  -37.048 2.7  356.879  -11.218    7.3  0.75   9.8    0.0  0.00   0.0
H 1820-303            275.948  -30.385 3.3    2.779   -7.947    4.1  0.53   7.7    0.0  0.00   0.0
GX 9+1                270.367  -20.553 3.4    9.048   +1.156    3.8  0.51   7.6    0.0  0.00   0.0
GX 349+2              256.505  -36.431 4.2  349.131   +2.699    4.0  0.68   5.9    0.0  0.00   0.0
GX 17+2               273.979  -14.106 4.9   16.359   +1.267   13.3  2.62   5.1    0.0  0.00   0.0
SAX J1810.8-2609      272.683  -26.129 4.9    5.215   -3.419    2.0  0.40   5.1    0.0  0.00   0.0
JEM-X
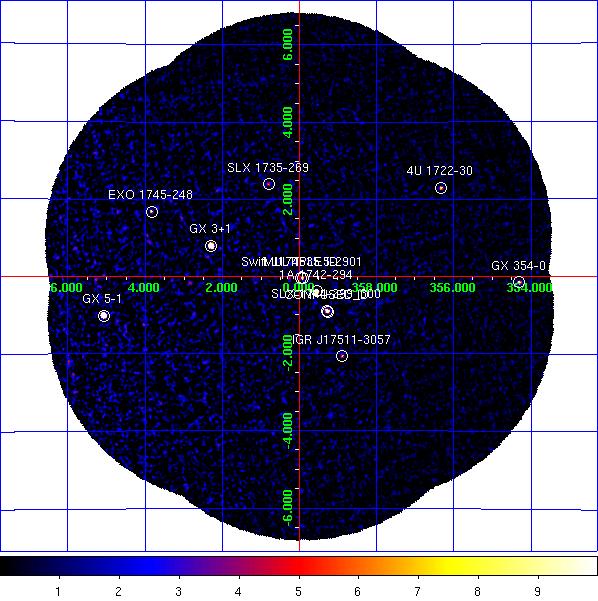
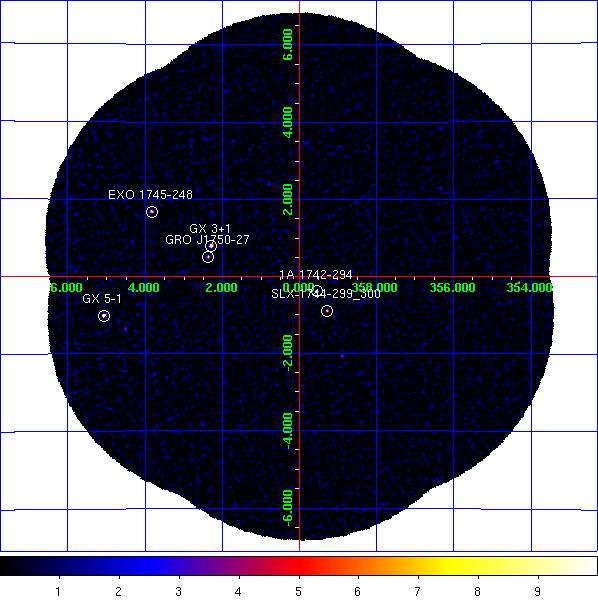
JEM-X1+2 combined significance mosaic images. Left: 3-10 keV. Right: 10-25 keV.
Sources labelled were detected in the 3-10 keV image > 6σ. The sources detected above 3σ in the 3-10 keV and/or 10-25 keV band are listed in the table below. Fluxes are extracted at the known catalogue position of the source (i.e. no fitting of the source position is done), with
mosaic_spec, in two bands: A = 3-10 keV (1 Crab ~ 97 cps [J1], 103 cps [J2]); B = 10-25 keV (1 Crab ~ 29 cps [J1], 27 cps [J2]). NOTES: The object marked as SLX 1744-299_300 is used to indicate two low-mass x-ray binaries separated by 2.7 arcminutes, SLX 1744-299 and SLX 1744-300; the position for SLX 1744-299 is used, although it can not be ruled out that SLX 1744-300 may dominate the emission some of the time. The systematic noise increases towards the edge of the field of view and in the vicinity of very bright sources, such as GX 5-1;
NEW SOURCEs < 6σ towards the border of the image and/or near GX 5-1 may, therefore, be spurious.
JEM-X1+2 Detected Sources in 3-10 keV (A) and 10-25 keV (B).
Source Name             RA       dec      l        b     A(cps)  +/-   sig  B(cps)  +/-   sig
==================== ========  ======= ======== ======== ====== ===== ===== ====== ===== =====
1A 1742-294           266.517  -29.520  359.553   -0.388    6.9  0.21  33.1    1.3  0.12  10.6
1E 1743.1-2843        266.587  -28.729    0.260   -0.029    0.7  0.21   3.4    0.2  0.12   2.1
4U 1722-30            261.888  -30.802  356.320   +2.298    4.5  0.43  10.4    0.7  0.31   2.2
CONFUSED ID           266.858  -30.041  359.261   -0.911    4.1  0.21  19.4    0.7  0.13   5.6
GRS 1758-258          270.303  -25.741    4.511   -1.361    2.5  0.79   3.1    1.5  0.39   3.8
GX 3+1                266.982  -26.568    2.289   +0.792   26.0  0.31  84.4    2.9  0.16  18.2
GX 354-0              262.986  -33.837  354.299   -0.149   12.4  0.94  13.2    3.9  0.77   5.0
GX 5-1                270.275  -25.082    5.070   -1.013  115.3  1.36  84.9    8.4  0.57  14.7
MULTIPLE ID           266.421  -28.993  359.959   -0.042    1.4  0.20   6.9    0.3  0.12   2.7
SLX 1735-269          264.571  -26.994    0.796   +2.400    1.7  0.27   6.5    0.5  0.16   3.1
SLX 1744-299_300      266.858  -29.999  359.297   -0.889    4.1  0.21  19.2    0.8  0.13   6.2
Swift J174535.5-2901  266.398  -29.026  359.920   -0.042    1.8  0.20   8.9    0.4  0.12   3.3
XTE J1739-285         264.975  -28.496  359.714   +1.298    0.7  0.21   3.3    0.0  0.00   0.0
EXO 1745-248          267.023  -24.779    3.841   +1.685    5.0  0.54   9.3    3.0  0.30  10.1
IGR J17511-3057       267.787  -30.953  358.890   -2.066    1.9  0.26   7.2    0.6  0.16   3.7
NEW SOURCE            269.498  -24.437    5.278   -0.080    6.3  1.20   5.3    0.0  0.00   0.0
NEW SOURCE            271.909  -24.879    5.974   -2.204   16.9  2.88   5.9    0.0  0.00   0.0
NEW SOURCE            268.228  -26.582    2.849   -0.171    1.7  0.33   5.0    0.0  0.00   0.0
NEW SOURCE            269.929  -26.106    4.026   -1.250    3.0  0.60   5.0    0.3  0.30   1.1
GRO J1750-27          267.300  -26.647    2.369   +0.508    1.2  0.30   4.1    1.2  0.16   7.4