INTEGRAL Galactic bulge Monitoring
Revolution 1508: Observation start 2015-02-17T12:53 = MJD 57070.538
Total Observation GTI = 14243 seconds
IBIS/ISGRI
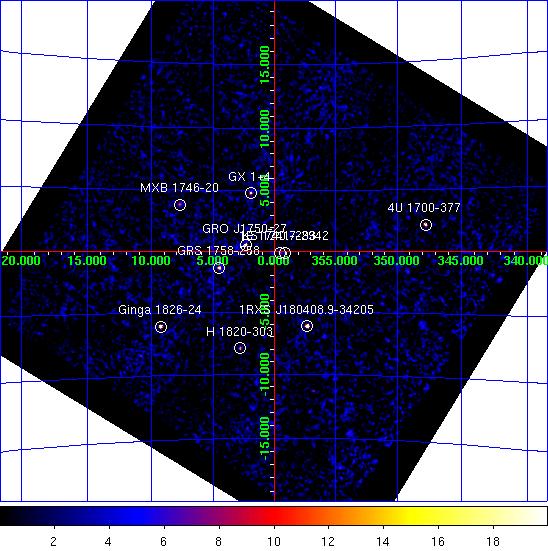
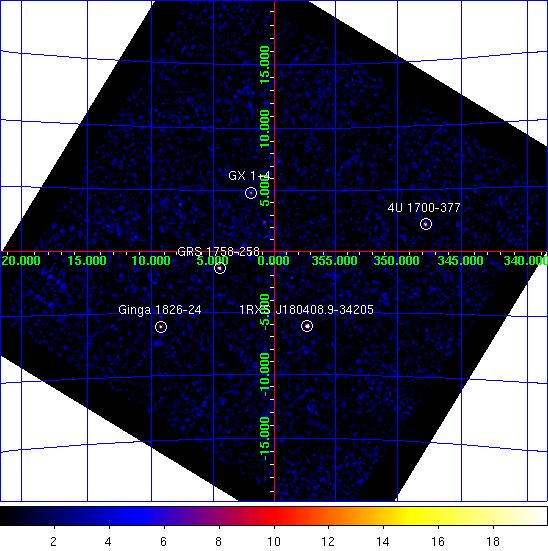
IBIS/ISGRI significance mosaic images. Left: IBIS/ISGRI 18-40 keV. Right: 40-100 keV
Sources detected > 10σ in each band are marked on the image. The table below lists the fitted position, and statistical positional uncertainty in arcmin returned by the mosaic step of
OSA10.1, of all the sources detected in the 18 - 40 keV range (band A: 1 Crab ~ 208 cps ) and 40 - 100 keV range (band B: 1 Crab ~ 100 cps ) where available.NOTES: The table is constructed from the
isgri_mosa_res.fits file - fluxes in the mosaic output are known to be systematically ~10% lower than in the ScW light-curves (see known issues). The systematic noise increases towards the edge of the field of view and NEW SOURCEs < 6σ towards the border of the image may be spurious. IBIS/ISGRI Detected Sources 18-40 keV (A) and 40-100 keV (B)
Source Name             RA       dec   +/-    l        b     A(cps)  +/-   sig  B(cps)  +/-   sig
==================== ========  ======= === ======== ======== ====== ===== ===== ====== ===== =====
1RXS J180408.9-34205  271.028  -34.345 0.7  357.297   -6.119   22.3  0.41  53.8   10.8  0.26  41.4
GRO J1750-27          267.290  -26.628 0.9    2.380   +0.526   11.8  0.35  34.0    1.2  0.00   5.2
Ginga 1826-24         277.360  -23.799 1.0    9.267   -6.082   22.8  0.72  31.7    8.3  0.43  19.2
GRS 1758-258          270.294  -25.724 1.2    4.522   -1.345    9.4  0.36  26.0    7.4  0.23  31.5
4U 1700-377           255.998  -37.856 1.1  347.750   +2.159   18.3  0.68  27.1    7.4  0.42  17.6
GX 1+4                263.010  -24.746 1.4    1.937   +4.794    8.1  0.38  21.1    0.0  0.00   0.0
H 1820-303            275.906  -30.345 1.9    2.798   -7.897    8.0  0.54  14.9    0.0  0.00   0.0
MXB 1746-20           267.192  -20.356 2.5    7.719   +3.826    5.0  0.47  10.6    2.0  0.30   6.9
KS 1741-293           266.219  -29.394 2.4  359.525   -0.100    3.5  0.32  11.0    1.4  0.22   6.7
GX 5-1                270.263  -25.099 2.7    5.050   -1.011    3.5  0.35   9.9    0.0  0.00   0.0
1E 1740.7-2942        265.992  -29.740 2.5  359.126   -0.113    3.4  0.32  10.5    2.1  0.22   9.4
3A 1822-371           276.432  -37.159 2.7  356.797  -11.305    6.4  0.66   9.8    0.0  0.00   0.0
GRS 1747-312          267.652  -31.248 3.4  358.577   -2.118    2.5  0.33   7.6    1.8  0.22   8.2
SLX 1744-299_300      266.858  -30.034 3.0  359.266   -0.907    2.9  0.34   8.7    1.2  0.23   5.2
GX 3+1                266.955  -26.539 0.0    2.302   +0.828    2.4  0.00   6.7    0.0  0.00   0.0
GX 349+2              256.439  -36.409 3.5  349.116   +2.754    5.4  0.73   7.4    0.0  0.00   0.0
SLX 1735-269          264.541  -27.017 4.5    0.763   +2.411    2.1  0.37   5.6    2.2  0.25   8.9
GX 354-0              262.950  -33.883 4.1  354.243   -0.149    2.3  0.00   6.1    0.0  0.00   0.0
1E 1742.9-2849        266.600  -28.830 4.7    0.180   -0.091    1.9  0.35   5.3    0.0  0.00   0.0
4U 1722-30            261.905  -30.767 4.4  356.357   +2.305    2.1  0.36   5.7    0.0  0.00   0.0
GX 9+1                270.311  -20.547 0.0    9.027   +1.204    2.5  0.00   5.1    0.0  0.00   0.0
IGR J16558-4150       253.810  -41.796 4.9  343.613   +1.047    8.1  0.00   5.1    0.0  0.00   0.0
V745 Sco              268.759  -33.337 5.0  357.247   -3.983    1.7  0.00   4.9    0.0  0.00   0.0
IGR J17252-3616       261.301  -36.217 4.5  351.553   -0.319    2.8  0.50   5.6    0.0  0.00   0.0
GRS 1739-278          265.670  -27.805 4.6    0.625   +1.143    1.9  0.36   5.5    1.3  0.24   5.7
GX 13+1               273.538  -17.115 0.0   13.511   +0.205    3.8  0.00   4.5    0.0  0.00   0.0
SAX J1806.5-2215      271.688  -22.204 5.6    8.214   -0.727    2.0  0.00   4.4    1.3  0.30   4.4
EXO 1745-248          267.126  -24.734 0.0    3.928   +1.628    1.5  0.00   4.3    0.0  0.00   0.0
IGR J17451-3022       266.308  -30.488 5.9  358.632   -0.737    1.4  0.00   4.1    0.0  0.00   0.0
IGR J17544-2619       268.591  -26.257 7.6    3.294   -0.287    1.1  0.36   3.1    0.0  0.00   0.0
IGR J17379-3747       264.656  -37.729 0.0  351.752   -3.390    1.9  0.00   4.1    0.0  0.00   0.0
PKS 1830-211          278.404  -20.972 0.0   12.240   -5.660    3.5  0.00   4.0    0.0  0.00   0.0
JEM-X
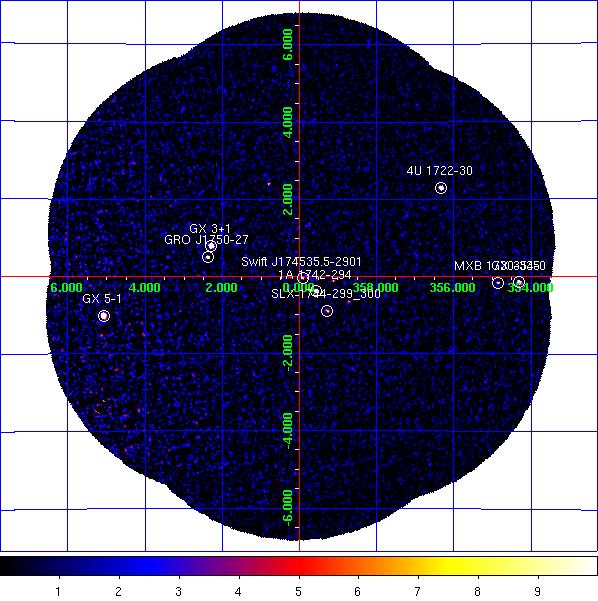
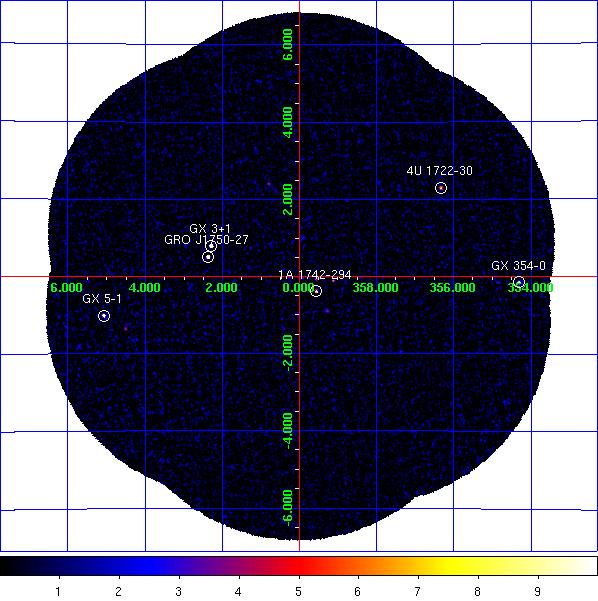
JEM-X1+2 combined significance mosaic images. Left: 3-10 keV. Right: 10-25 keV.
Sources labelled were detected in the 3-10 keV image > 6σ. The sources detected above 3σ in the 3-10 keV and/or 10-25 keV band are listed in the table below. Fluxes are extracted at the known catalogue position of the source (i.e. no fitting of the source position is done), with
mosaic_spec, in two bands: A = 3-10 keV (1 Crab ~ 97 cps [J1], 103 cps [J2]); B = 10-25 keV (1 Crab ~ 29 cps [J1], 27 cps [J2]). NOTES: The object marked as SLX 1744-299_300 is used to indicate two low-mass x-ray binaries separated by 2.7 arcminutes, SLX 1744-299 and SLX 1744-300; the position for SLX 1744-299 is used, although it can not be ruled out that SLX 1744-300 may dominate the emission some of the time. The systematic noise increases towards the edge of the field of view and in the vicinity of very bright sources, such as GX 5-1;
NEW SOURCEs < 6σ towards the border of the image and/or near GX 5-1 may, therefore, be spurious.
JEM-X1+2 Detected Sources in 3-10 keV (A) and 10-25 keV (B).
Source Name             RA       dec      l        b     A(cps)  +/-   sig  B(cps)  +/-   sig
==================== ========  ======= ======== ======== ====== ===== ===== ====== ===== =====
1A 1742-294           266.522  -29.503  359.569   -0.383    8.4  0.22  38.3    1.4  0.13  10.9
1E 1740.7-2942        265.978  -29.745  359.116   -0.106    1.0  0.21   4.9    0.5  0.13   4.2
1E 1743.1-2843        266.587  -28.729    0.260   -0.029    1.2  0.22   5.5    0.4  0.13   2.8
4U 1722-30            261.881  -30.798  356.320   +2.306   19.0  0.48  39.4    3.2  0.32  10.2
GRO J1750-27          267.306  -26.635    2.382   +0.510    4.7  0.34  13.9    4.1  0.19  22.1
GRS 1758-258          270.303  -25.741    4.511   -1.361    0.9  0.81   1.1    1.5  0.40   3.7
GX 3+1                266.980  -26.565    2.291   +0.795   35.4  0.34 102.8    3.7  0.18  21.0
GX 354-0              262.992  -33.835  354.303   -0.152   26.5  0.89  29.6    6.5  0.67   9.7
GX 5-1                270.283  -25.080    5.076   -1.018  126.0  1.37  92.3    9.3  0.59  15.8
MXB 1730-335          263.350  -33.388  354.841   -0.158    5.4  0.62   8.8    1.4  0.44   3.3
SLX 1735-269          264.571  -26.994    0.796   +2.400    1.5  0.30   5.2    0.7  0.17   3.8
SLX 1744-299_300      266.858  -29.999  359.297   -0.889    1.7  0.21   8.0    0.6  0.13   4.3
Swift J174535.5-2901  266.398  -29.026  359.920   -0.042    1.8  0.22   8.3    0.3  0.13   2.5
IGR J17451-3022       266.285  -30.376  358.717   -0.662    1.2  0.20   5.9    0.0  0.00   0.0
NEW SOURCE            270.817  -25.277    5.143   -1.535    6.9  1.31   5.2    0.0  0.00   0.0
KS 1741-293           266.206  -29.342  359.563   -0.063    0.9  0.21   4.4    0.5  0.13   4.2