INTEGRAL Galactic bulge Monitoring
Revolution 1466: Observation start 2014-10-16T23:30 = MJD 56946.98
Total Observation GTI = 12192 seconds
IBIS/ISGRI
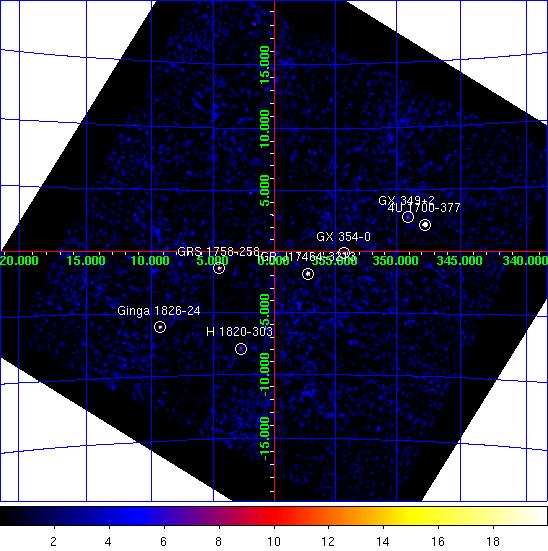
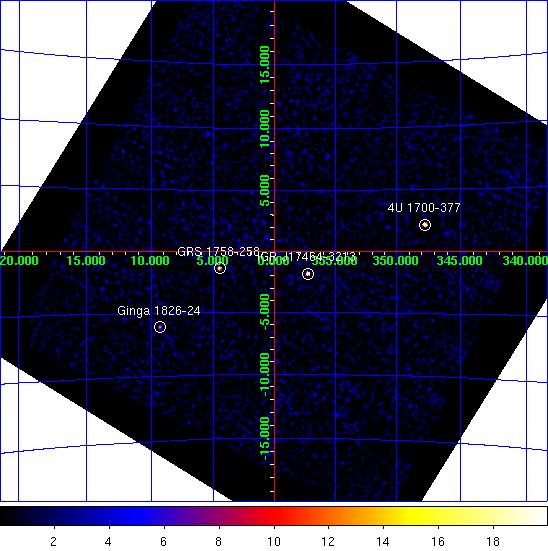
IBIS/ISGRI significance mosaic images. Left: IBIS/ISGRI 18-40 keV. Right: 40-100 keV
Sources detected > 10σ in each band are marked on the image. The table below lists the fitted position, and statistical positional uncertainty in arcmin returned by the mosaic step of
OSA10.1, of all the sources detected in the 18 - 40 keV range (band A: 1 Crab ~ 208 cps ) and 40 - 100 keV range (band B: 1 Crab ~ 100 cps ) where available.NOTES: The table is constructed from the
isgri_mosa_res.fits file - fluxes in the mosaic output are known to be systematically ~10% lower than in the ScW light-curves (see known issues). The systematic noise increases towards the edge of the field of view and NEW SOURCEs < 6σ towards the border of the image may be spurious. IBIS/ISGRI Detected Sources 18-40 keV (A) and 40-100 keV (B)
Source Name             RA       dec   +/-    l        b     A(cps)  +/-   sig  B(cps)  +/-   sig
==================== ========  ======= === ======== ======== ====== ===== ===== ====== ===== =====
4U 1700-377           255.981  -37.851 0.5  347.746   +2.173   59.0  0.78  75.9   20.9  0.49  42.5
IGR J17464-3213       266.564  -32.236 0.7  357.253   -1.834   20.4  0.41  49.6   15.1  0.29  52.9
GRS 1758-258          270.299  -25.743 1.0    4.507   -1.359   12.4  0.41  30.2    9.5  0.28  34.4
Ginga 1826-24         277.378  -23.804 1.3    9.271   -6.100   17.7  0.77  22.9    7.1  0.50  14.3
GX 354-0              262.975  -33.853 1.5  354.281   -0.150    7.5  0.38  19.5    0.0  0.00   0.0
H 1820-303            275.906  -30.379 2.2    2.767   -7.912    6.5  0.53  12.4    0.0  0.00   0.0
GX 349+2              256.401  -36.388 2.5  349.115   +2.791    6.5  0.60  10.8    0.0  0.00   0.0
GX 1+4                263.035  -24.728 3.0    1.964   +4.784    3.8  0.43   8.7    0.0  0.00   0.0
IGR J17454-2919       266.437  -29.380 3.6  359.636   -0.255    2.6  0.36   7.2    0.0  0.00   0.0
GX 5-1                270.257  -25.120 5.3    5.029   -1.017    2.0  0.42   4.6    0.0  0.00   0.0
1A 1743-288           266.805  -28.890 3.7    0.222   -0.275    2.6  0.37   6.9    0.0  0.00   0.0
3A 1822-371           276.407  -37.119 0.0  356.825  -11.270    4.0  0.00   5.6    0.0  0.00   0.0
JEM-X
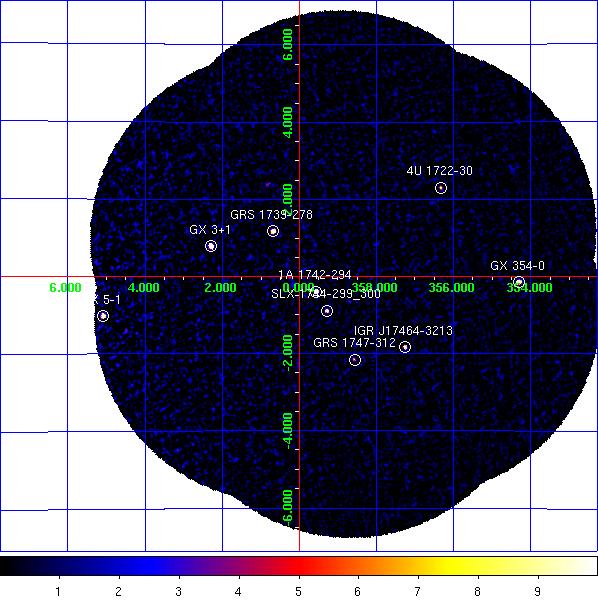
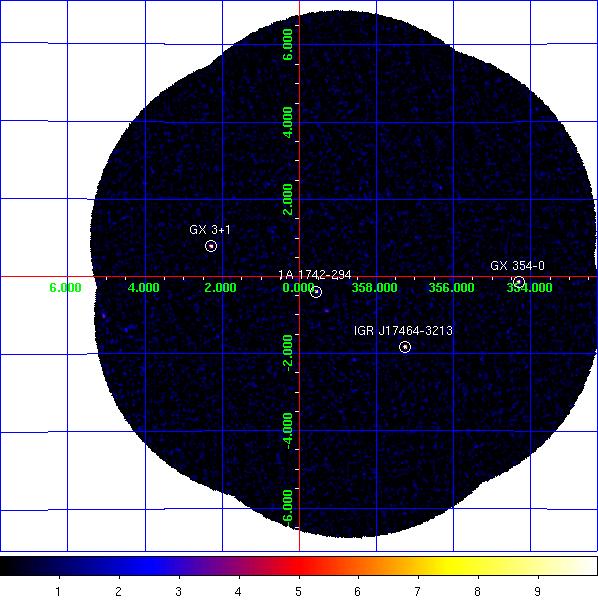
JEM-X1+2 combined significance mosaic images. Left: 3-10 keV. Right: 10-25 keV.
Sources labelled were detected in the 3-10 keV image > 6σ. The sources detected above 3σ in the 3-10 keV and/or 10-25 keV band are listed in the table below. Fluxes are extracted at the known catalogue position of the source (i.e. no fitting of the source position is done), with
mosaic_spec, in two bands: A = 3-10 keV (1 Crab ~ 109 cps [J1], 116 cps [J2]); B = 10-25 keV (1 Crab ~ 34 cps [J1], 32 cps [J2]). NOTES: The object marked as SLX 1744-299_300 is used to indicate two low-mass x-ray binaries separated by 2.7 arcminutes, SLX 1744-299 and SLX 1744-300; the position for SLX 1744-299 is used, although it can not be ruled out that SLX 1744-300 may dominate the emission some of the time. The systematic noise increases towards the edge of the field of view and in the vicinity of very bright sources, such as GX 5-1;
NEW SOURCEs < 6σ towards the border of the image and/or near GX 5-1 may, therefore, be spurious.
JEM-X1+2 Detected Sources in 3-10 keV (A) and 10-25 keV (B).
Source Name             RA       dec      l        b     A(cps)  +/-   sig  B(cps)  +/-   sig
==================== ========  ======= ======== ======== ====== ===== ===== ====== ===== =====
1A 1742-294           266.526  -29.517  359.559   -0.392    8.4  0.25  33.3    1.3  0.14   8.9
1E 1743.1-2843        266.587  -28.729    0.260   -0.029    1.1  0.26   4.2    0.2  0.15   1.6
4U 1722-30            261.888  -30.802  356.320   +2.298    3.0  0.34   8.7    0.5  0.22   2.4
GRS 1739-278          265.675  -27.733    0.689   +1.177   11.1  0.31  35.9    0.3  0.17   1.9
GRS 1747-312          267.690  -31.292  358.555   -2.168    1.6  0.26   6.1    0.4  0.16   2.5
GX 3+1                266.988  -26.567    2.293   +0.788   33.5  0.52  64.9    3.8  0.27  14.3
GX 354-0              262.991  -33.832  354.305   -0.150   21.4  0.54  39.9    4.6  0.34  13.2
GX 5-1                270.296  -25.071    5.089   -1.024  102.1  3.51  29.1    7.5  1.94   3.9
IGR J17464-3213       266.571  -32.232  357.259   -1.836    4.5  0.28  16.3    2.6  0.18  14.5
SLX 1735-269          264.571  -26.994    0.796   +2.400    1.4  0.37   3.9    0.4  0.21   1.7
SLX 1744-299_300      266.858  -29.999  359.297   -0.889    3.8  0.25  15.1    0.6  0.14   4.0
IGR J17451-3022       266.265  -30.381  358.704   -0.649    0.7  0.22   3.3    0.0  0.00   0.0
NEW SOURCE            271.308  -26.037    4.697   -2.294    8.3  2.42   3.4    0.0  0.00   0.0