INTEGRAL Galactic bulge Monitoring
Revolution 1464: Observation start 2014-10-11T05:41 = MJD 56941.238
Total Observation GTI = 12192 seconds
IBIS/ISGRI

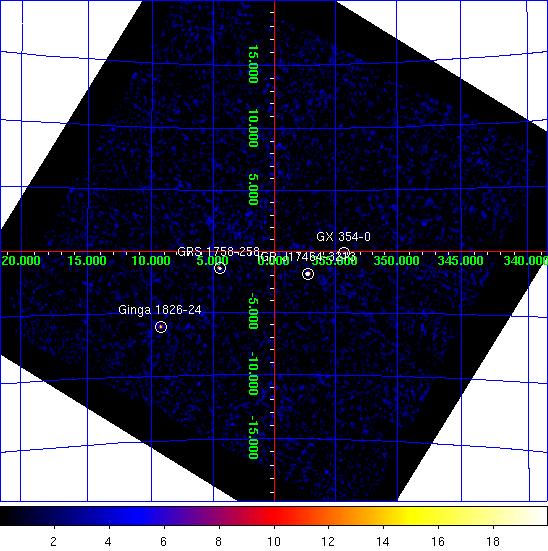
IBIS/ISGRI significance mosaic images. Left: IBIS/ISGRI 18-40 keV. Right: 40-100 keV
Sources detected > 10σ in each band are marked on the image. The table below lists the fitted position, and statistical positional uncertainty in arcmin returned by the mosaic step of
OSA10.1, of all the sources detected in the 18 - 40 keV range (band A: 1 Crab ~ 208 cps ) and 40 - 100 keV range (band B: 1 Crab ~ 100 cps ) where available.NOTES: The table is constructed from the
isgri_mosa_res.fits file - fluxes in the mosaic output are known to be systematically ~10% lower than in the ScW light-curves (see known issues). The systematic noise increases towards the edge of the field of view and NEW SOURCEs < 6σ towards the border of the image may be spurious. IBIS/ISGRI Detected Sources 18-40 keV (A) and 40-100 keV (B)
Source Name             RA       dec   +/-    l        b     A(cps)  +/-   sig  B(cps)  +/-   sig
==================== ========  ======= === ======== ======== ====== ===== ===== ====== ===== =====
IGR J17464-3213       266.566  -32.237 0.6  357.253   -1.835   23.8  0.36  66.1   16.2  0.24  66.4
GX 354-0              262.989  -33.834 0.8  354.303   -0.150   19.4  0.43  45.1    4.7  0.28  16.6
GRS 1758-258          270.314  -25.751 1.1    4.506   -1.374   11.0  0.39  28.6    8.6  0.25  33.8
GX 5-1                270.288  -25.073 1.1    5.084   -1.018   11.6  0.42  27.4    0.0  0.00   0.0
Ginga 1826-24         277.358  -23.809 1.1    9.258   -6.086   18.9  0.70  27.0    6.2  0.43  14.4
H 1820-303            275.916  -30.326 2.3    2.819   -7.895    5.8  0.50  11.7    0.0  0.00   0.0
4U 1700-377           256.012  -37.837 2.4  347.772   +2.162    8.4  0.77  10.9    2.6  0.00   5.1
SLX 1735-269          264.525  -27.045 2.6    0.731   +2.407    3.6  0.36  10.0    1.5  0.25   6.1
GX 17+2               273.991  -13.967 3.0   16.486   +1.323   20.0  2.34   8.6    0.0  0.00   0.0
GX 9+1                270.359  -20.601 3.9    9.003   +1.139    3.5  0.53   6.6    0.0  0.00   0.0
GX 1+4                262.986  -24.740 3.1    1.930   +4.816    3.1  0.37   8.3    0.0  0.00   0.0
3A 1822-371           276.503  -37.135 3.8  356.843  -11.345    5.5  0.83   6.6    0.0  0.00   0.0
GX 349+2              256.407  -36.458 4.4  349.062   +2.745    3.8  0.67   5.6    0.0  0.00   0.0
IGR J17454-2919       266.388  -29.302 4.6  359.680   -0.178    2.0  0.38   5.4    1.9  0.26   7.3
GX 3+1                266.979  -26.509 3.9    2.338   +0.825    2.5  0.39   6.4    0.0  0.00   0.0
V2400 Oph             258.147  -24.261 0.0  359.851   +8.734    2.5  0.00   4.9    0.0  0.00   0.0
MAXI J1836-194        278.930  -19.341 0.0   13.926   -5.363    6.7  0.00   4.9    0.0  0.00   0.0
GX 13+1               273.580  -17.145 4.4   13.504   +0.156    5.0  0.88   5.7    0.0  0.00   0.0
SAX J1818.6-1703      274.653  -17.028 4.9   14.095   -0.691    4.9  0.97   5.0    0.0  0.00   0.0
1E 1740.7-2942        265.956  -29.793 5.6  359.064   -0.114    1.5  0.00   4.4    1.3  0.23   5.5
4U 1722-30            261.855  -30.761 6.2  356.338   +2.345    1.6  0.41   3.9    0.0  0.00   0.0
IGR J18027-2016       270.617  -20.239 0.0    9.436   +1.107    2.4  0.00   4.4    0.0  0.00   0.0
Swift J1713.4-4219    258.307  -42.423 5.3  345.141   -1.984    8.6  1.85   4.7    0.0  0.00   0.0
GRS 1734-292          264.406  -29.118 4.9  358.922   +1.388    1.9  0.38   5.0    0.0  0.00   0.0
MXB 1730-335          263.365  -33.341 5.4  354.887   -0.143    1.8  0.39   4.5    0.0  0.00   0.0
GRS 1747-312          267.692  -31.292 6.2  358.556   -2.169    1.3  0.35   3.9    0.0  0.00   0.0
IGR J17498-2921       267.552  -29.289 6.1    0.216   -1.040    1.5  0.39   4.0    0.0  0.00   0.0
1RXS J175721.2-30440  269.401  -30.812 0.0  359.711   -3.191    1.5  0.00   3.8    0.0  0.00   0.0
AX J1820.5-1434       275.184  -14.571 0.0   16.502   +0.019    7.5  0.00   3.9    0.0  0.00   0.0
OAO 1657-415          255.201  -41.715 0.0  344.321   +0.285    7.6  0.00   3.9    0.0  0.00   0.0
JEM-X
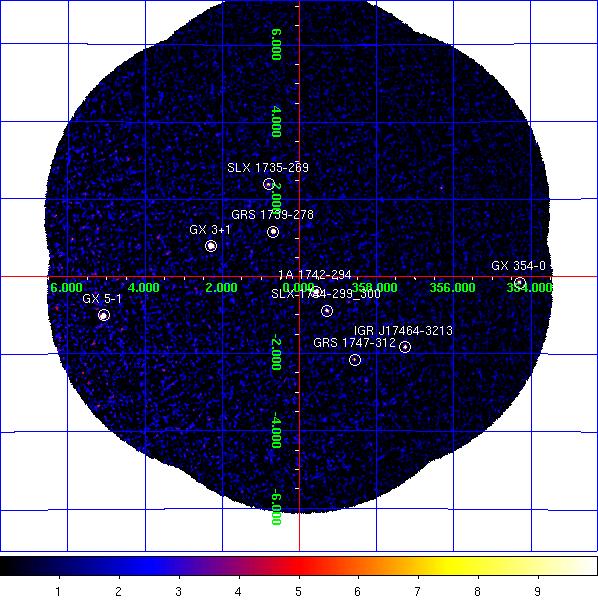
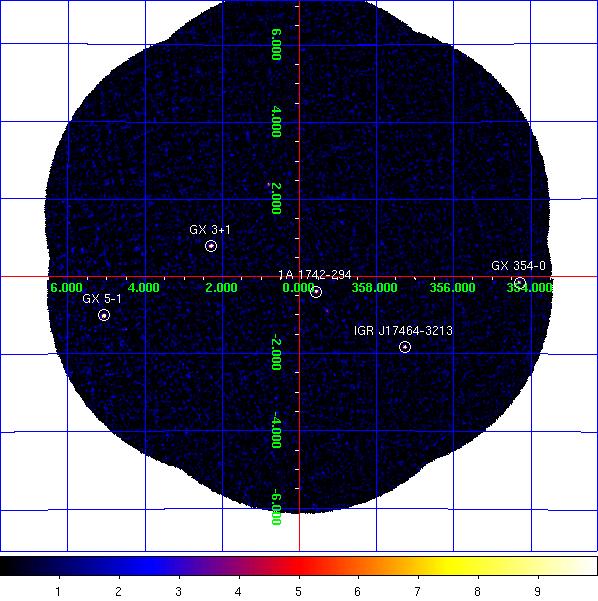
JEM-X1+2 combined significance mosaic images. Left: 3-10 keV. Right: 10-25 keV.
Sources labelled were detected in the 3-10 keV image > 6σ. The sources detected above 3σ in the 3-10 keV and/or 10-25 keV band are listed in the table below. Fluxes are extracted at the known catalogue position of the source (i.e. no fitting of the source position is done), with
mosaic_spec, in two bands: A = 3-10 keV (1 Crab ~ 109 cps [J1], 116 cps [J2]); B = 10-25 keV (1 Crab ~ 34 cps [J1], 32 cps [J2]). NOTES: The object marked as SLX 1744-299_300 is used to indicate two low-mass x-ray binaries separated by 2.7 arcminutes, SLX 1744-299 and SLX 1744-300; the position for SLX 1744-299 is used, although it can not be ruled out that SLX 1744-300 may dominate the emission some of the time. The systematic noise increases towards the edge of the field of view and in the vicinity of very bright sources, such as GX 5-1;
NEW SOURCEs < 6σ towards the border of the image and/or near GX 5-1 may, therefore, be spurious.
JEM-X1+2 Detected Sources in 3-10 keV (A) and 10-25 keV (B).
Source Name             RA       dec      l        b     A(cps)  +/-   sig  B(cps)  +/-   sig
==================== ========  ======= ======== ======== ====== ===== ===== ====== ===== =====
1A 1742-294           266.536  -29.507  359.572   -0.395   11.4  0.28  40.4    1.9  0.14  13.0
1E 1743.1-2843        266.587  -28.729    0.260   -0.029    1.0  0.27   3.7    0.2  0.14   1.8
4U 1722-30            261.888  -30.802  356.320   +2.298    2.1  0.46   4.4    0.5  0.29   1.8
GRS 1739-278          265.683  -27.750    0.678   +1.162   10.1  0.27  36.8    0.0  0.00   0.0
GRS 1747-312          267.690  -31.292  358.555   -2.168    2.3  0.38   6.0    0.2  0.21   1.1
GX 3+1                266.986  -26.566    2.293   +0.790   40.6  0.39 103.6    4.1  0.19  22.0
GX 354-0              262.992  -33.842  354.297   -0.156   21.2  1.16  18.3    6.9  0.81   8.5
GX 5-1                270.270  -25.081    5.069   -1.008  128.0  1.66  77.3   20.0  0.79  25.1
IGR J17464-3213       266.571  -32.230  357.261   -1.835    6.2  0.45  13.7    3.3  0.26  12.8
SLX 1735-269          264.571  -26.994    0.796   +2.400    2.7  0.28   9.6    0.8  0.15   5.5
SLX 1744-299_300      266.858  -29.999  359.297   -0.889    3.5  0.29  12.2    0.6  0.15   3.8
NEW SOURCE            270.730  -23.931    6.276   -0.804   20.2  3.85   5.2    0.0  0.00   0.0
NEW SOURCE            271.114  -25.210    5.334   -1.737    8.2  2.08   3.9    0.0  0.00   0.0
NEW SOURCE            267.544  -25.272    3.661   +1.027    2.7  0.56   4.8    0.4  0.28   1.5
NEW SOURCE            268.854  -23.395    5.884   +0.953    8.6  1.80   4.8    0.0  0.00   0.0
NEW SOURCE            268.956  -23.748    5.627   +0.694    4.8  1.52   3.1    2.2  0.85   2.7