INTEGRAL Galactic bulge Monitoring
Revolution 1460: Observation start 2014-09-27T19:00 = MJD 56927.792
Total Observation GTI = 12207 seconds
IBIS/ISGRI
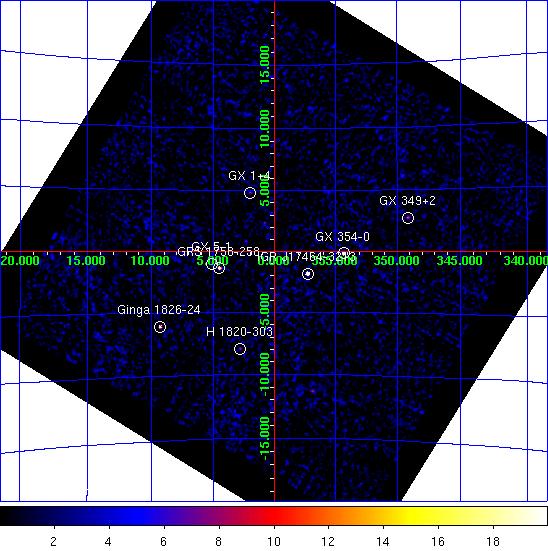
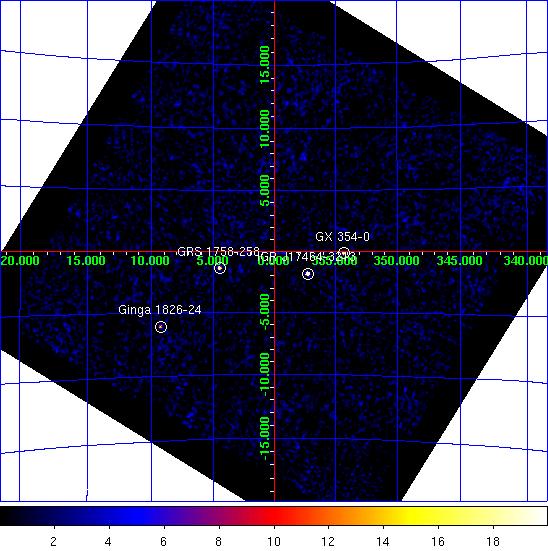
IBIS/ISGRI significance mosaic images. Left: IBIS/ISGRI 18-40 keV. Right: 40-100 keV
Sources detected > 10σ in each band are marked on the image. The table below lists the fitted position, and statistical positional uncertainty in arcmin returned by the mosaic step of
OSA10.1, of all the sources detected in the 18 - 40 keV range (band A: 1 Crab ~ 208 cps ) and 40 - 100 keV range (band B: 1 Crab ~ 100 cps ) where available.NOTES: The table is constructed from the
isgri_mosa_res.fits file - fluxes in the mosaic output are known to be systematically ~10% lower than in the ScW light-curves (see known issues). The systematic noise increases towards the edge of the field of view and NEW SOURCEs < 6σ towards the border of the image may be spurious. IBIS/ISGRI Detected Sources 18-40 keV (A) and 40-100 keV (B)
Source Name             RA       dec   +/-    l        b     A(cps)  +/-   sig  B(cps)  +/-   sig
==================== ========  ======= === ======== ======== ====== ===== ===== ====== ===== =====
IGR J17464-3213       266.565  -32.229 0.5  357.259   -1.830   29.8  0.40  73.7   19.6  0.28  70.9
GX 354-0              262.990  -33.833 0.7  354.304   -0.150   20.2  0.44  46.3    8.5  0.29  29.1
GRS 1758-258          270.304  -25.738 1.0    4.514   -1.360   11.6  0.39  29.5    9.4  0.26  35.7
Ginga 1826-24         277.370  -23.791 1.2    9.279   -6.087   18.9  0.75  25.4    8.0  0.47  17.1
GX 5-1                270.267  -25.059 2.1    5.087   -0.995    5.6  0.44  12.8    0.0  0.00   0.0
GX 349+2              256.440  -36.419 2.2  349.109   +2.748    8.1  0.65  12.6    0.0  0.00   0.0
GX 1+4                263.007  -24.689 2.3    1.984   +4.827    5.0  0.43  11.5    0.0  0.00   0.0
3A 1822-371           276.467  -37.118 2.8  356.846  -11.312    7.1  0.76   9.4    0.0  0.00   0.0
H 1820-303            275.943  -30.353 2.6    2.805   -7.928    6.5  0.63  10.3    0.0  0.00   0.0
SLX 1735-269          264.619  -27.007 3.1    0.808   +2.358    3.2  0.00   8.3    1.1  0.26   4.1
SLX 1744-299_300      266.846  -29.988 3.6  359.301   -0.874    2.7  0.39   7.0    0.0  0.00   0.0
1E 1740.7-2942        265.959  -29.742 4.0  359.110   -0.090    2.3  0.36   6.4    1.7  0.25   7.0
GX 3+1                266.981  -26.532 3.2    2.320   +0.812    3.5  0.43   8.1    0.0  0.00   0.0
IGR J17456-2901       266.426  -28.952 4.6  359.996   -0.024    2.0  0.36   5.5    0.0  0.00   0.0
H 1705-440            257.103  -44.038 6.3  343.319   -2.232   16.7  4.32   3.9    0.0  0.00   0.0
4U 1722-30            261.940  -30.766 4.9  356.375   +2.281    2.2  0.43   5.0    0.0  0.00   0.0
IGR J17454-2919       266.348  -29.371 4.5  359.603   -0.185    1.9  0.34   5.5    1.0  0.00   4.3
1H 1746-370           267.454  -37.021 4.8  353.518   -4.921    2.8  0.53   5.2    0.0  0.00   0.0
IGR J17404-3655       265.161  -36.985 6.5  352.597   -3.336    2.1  0.56   3.7    0.0  0.00   0.0
4U 1735-444           264.697  -44.464 5.3  346.025   -6.973   11.8  2.54   4.7    0.0  0.00   0.0
JEM-X
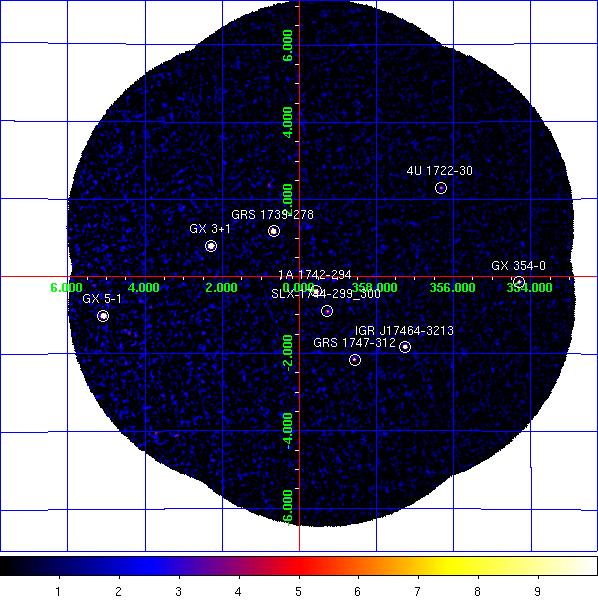
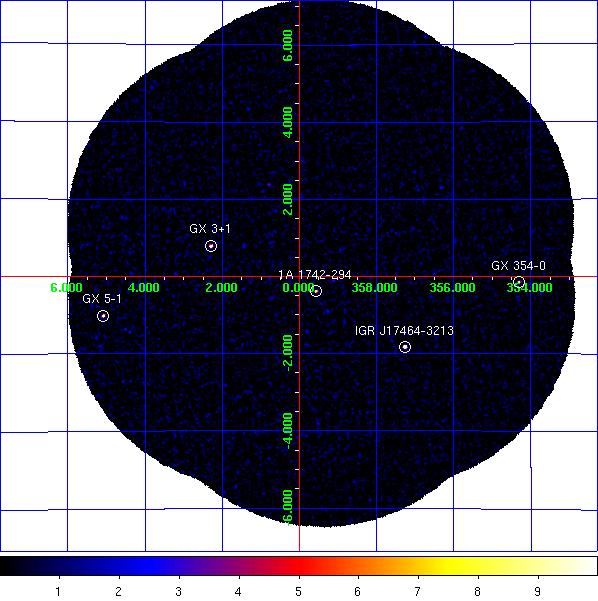
JEM-X1+2 combined significance mosaic images. Left: 3-10 keV. Right: 10-25 keV.
Sources labelled were detected in the 3-10 keV image > 6σ. The sources detected above 3σ in the 3-10 keV and/or 10-25 keV band are listed in the table below. Fluxes are extracted at the known catalogue position of the source (i.e. no fitting of the source position is done), with
mosaic_spec, in two bands: A = 3-10 keV (1 Crab ~ 109 cps [J1], 116 cps [J2]); B = 10-25 keV (1 Crab ~ 34 cps [J1], 32 cps [J2]). NOTES: The object marked as SLX 1744-299_300 is used to indicate two low-mass x-ray binaries separated by 2.7 arcminutes, SLX 1744-299 and SLX 1744-300; the position for SLX 1744-299 is used, although it can not be ruled out that SLX 1744-300 may dominate the emission some of the time. The systematic noise increases towards the edge of the field of view and in the vicinity of very bright sources, such as GX 5-1;
NEW SOURCEs < 6σ towards the border of the image and/or near GX 5-1 may, therefore, be spurious.
JEM-X1+2 Detected Sources in 3-10 keV (A) and 10-25 keV (B).
Source Name             RA       dec      l        b     A(cps)  +/-   sig  B(cps)  +/-   sig
==================== ========  ======= ======== ======== ====== ===== ===== ====== ===== =====
1A 1742-294           266.525  -29.509  359.566   -0.388    9.0  0.27  33.0    1.2  0.13   9.1
1E 1740.7-2942        265.978  -29.745  359.116   -0.106    0.9  0.25   3.6    0.4  0.13   2.7
4U 1722-30            261.888  -30.802  356.320   +2.298    2.7  0.41   6.6    0.6  0.24   2.3
GRS 1739-278          265.669  -27.753    0.669   +1.171   13.9  0.30  46.8    0.2  0.14   1.3
GRS 1741.9-2853       266.260  -28.914  359.953   +0.120    0.9  0.26   3.5    0.0  0.00   0.0
GRS 1747-312          267.690  -31.292  358.555   -2.168    2.5  0.31   7.9    0.0  0.00   0.0
GX 3+1                266.986  -26.562    2.296   +0.793   33.3  0.46  72.2    3.4  0.21  16.2
GX 354-0              262.989  -33.835  354.302   -0.150   10.2  0.73  14.1    3.8  0.47   8.0
GX 5-1                270.284  -25.079    5.077   -1.019  111.9  2.12  52.7   11.3  0.96  11.8
IGR J17464-3213       266.558  -32.239  357.247   -1.831    7.9  0.37  21.5    3.8  0.20  18.9
SLX 1735-269          264.571  -26.994    0.796   +2.400    1.2  0.33   3.6    0.5  0.17   2.9
SLX 1744-299_300      266.858  -29.999  359.297   -0.889    1.6  0.27   6.0    0.3  0.14   2.4
NEW SOURCE            272.512  -27.750    3.716   -4.062    8.4  2.00   4.2    0.0  0.00   0.0
NEW SOURCE            272.281  -28.238    3.189   -4.118    6.0  1.36   4.4    0.0  0.00   0.0
NEW SOURCE            270.347  -25.877    4.412   -1.462    5.1  1.30   3.9    1.0  0.58   1.7
NEW SOURCE            269.662  -24.481    5.315   -0.231    7.9  2.02   3.9    0.0  0.00   0.0
NEW SOURCE            270.325  -25.880    4.399   -1.447    4.8  1.29   3.7    1.2  0.58   2.0