INTEGRAL Galactic bulge Monitoring
Revolution 1447: Observation start 2014-08-19T16:40 = MJD 56888.695
Total Observation GTI = 12451 seconds
ISGRI
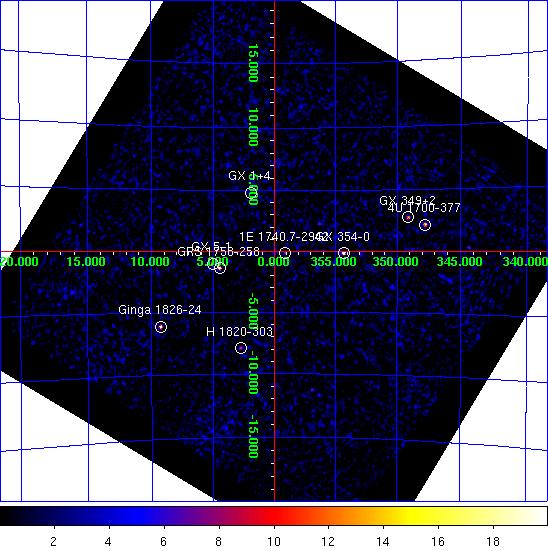
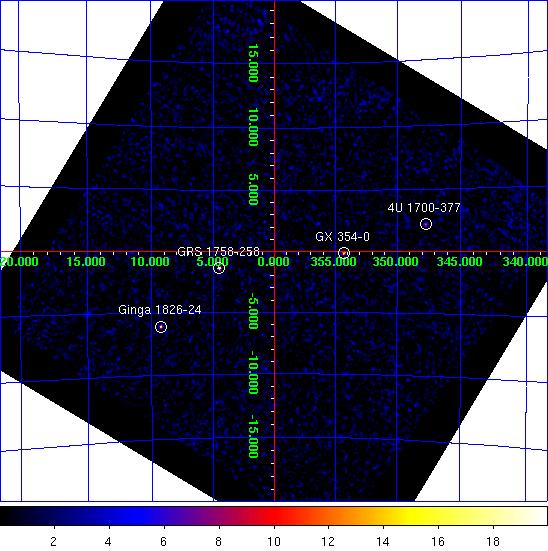
ISGRI significance mosaic images. Left: ISGRI 18-40 keV. Right: 40-100 keV
Sources detected > 10σ in each band are marked on the image. The table below lists the fitted position, and statistical positional uncertainty in arcmin returned by the mosaic step of
OSA9, of all the sources detected in the 18 - 40 keV range (band A: 1 Crab ~ 210 cps ) and 40 - 100 keV range (band B: 1 Crab ~ 104 cps ) where available.NOTES: The table is constructed from the
isgri_mosa_res.fits file - fluxes in the mosaic output are known to be systematically ~10% lower than in the ScW light-curves (see known issues). The systematic noise increases towards the edge of the field of view and NEW SOURCEs < 6σ towards the border of the image may be spurious. ISGRI Detected Sources 18-40 keV (A) and 40-100 keV (B)
Source Name             RA       dec   +/-    l        b     A(cps)  +/-   sig  B(cps)  +/-   sig
==================== ========  ======= === ======== ======== ====== ===== ===== ====== ===== =====
GX 354-0              262.990  -33.816 1.0  354.318   -0.140   14.1  0.43  33.0    4.8  0.27  18.0
GRS 1758-258          270.303  -25.752 1.0    4.501   -1.366   13.3  0.41  32.5    9.5  0.26  37.2
Ginga 1826-24         277.375  -23.789 1.2    9.283   -6.090   17.2  0.67  25.5    7.5  0.41  18.5
4U 1700-377           255.992  -37.849 1.3  347.753   +2.167   17.4  0.77  22.7    6.2  0.46  13.4
GX 5-1                270.284  -25.088 1.6    5.069   -1.023    7.9  0.43  18.3    0.0  0.00   0.0
GX 349+2              256.426  -36.409 1.8  349.110   +2.763   10.6  0.69  15.4    0.0  0.00   0.0
1E 1740.7-2942        266.004  -29.758 2.2  359.117   -0.132    4.7  0.39  12.2    1.7  0.25   6.8
H 1820-303            275.920  -30.364 2.3    2.786   -7.916    6.0  0.53  11.4    0.0  0.00   0.0
GX 1+4                263.025  -24.746 2.4    1.945   +4.783    5.2  0.46  11.3    0.0  0.00   0.0
3A 1822-371           276.435  -37.103 2.6  356.848  -11.283    7.0  0.67  10.4    0.0  0.00   0.0
OAO 1657-415          255.218  -41.686 3.0  344.352   +0.292   12.4  1.40   8.8    0.0  0.00   0.0
4U 1722-30            261.820  -30.823 3.7  356.269   +2.335    3.0  0.43   6.9    1.6  0.26   6.1
SLX 1735-269          264.610  -26.945 3.2    0.856   +2.397    3.5  0.44   8.1    1.8  0.28   6.6
GX 9+1                270.399  -20.530 4.1    9.082   +1.141    3.8  0.62   6.1    0.0  0.00   0.0
1H 1746-370           267.540  -37.096 4.2  353.488   -5.019    2.8  0.48   5.9    0.0  0.00   0.0
GRS 1741.9-2853       266.281  -28.924 5.1  359.954   +0.099    1.9  0.39   4.8    0.0  0.00   0.0
IGR J17404-3655       265.089  -36.963 4.7  352.586   -3.275    2.5  0.47   5.3    0.0  0.00   0.0
H 1702-429            256.601  -43.046 5.0  343.895   -1.346    7.8  1.59   4.9    0.0  0.00   0.0
NEW SOURCE            275.767  -35.841 4.0  357.765  -10.248    3.3  0.51   6.4    0.0  0.00   0.0
NEW SOURCE            259.333  -41.391 3.9  346.425   -2.004    6.1  0.94   6.6    0.0  0.00   0.0
NEW SOURCE            254.978  -14.873 4.5    5.972  +16.572   27.0  4.63   5.6    0.0  0.00   0.0
JEM-X

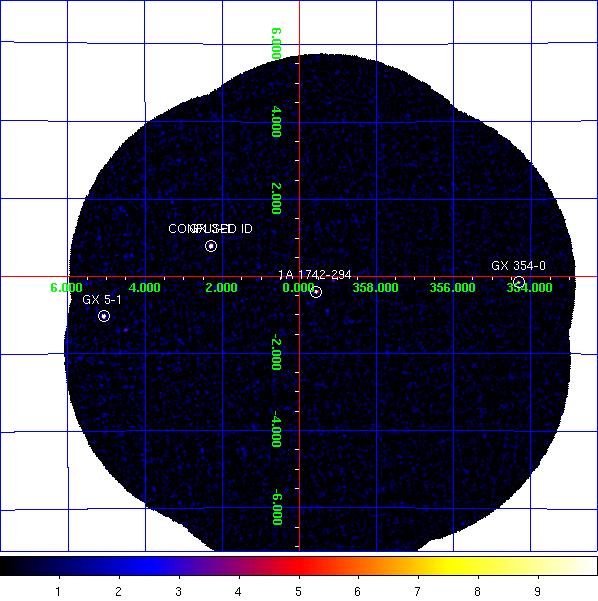
JEM-X1 significance mosaic images. Left: 3-10 keV. Right: 10-25 keV.
Sources labelled were detected in the 3-10 keV image > 6σ. The sources detected above 3σ in the 3-10 keV and/or 10-25 keV band are listed in the table below. Fluxes are extracted at the known catalogue position of the source (i.e. no fitting of the source position is done), with
mosaic_spec, in two bands: A = 3-10 keV (1 Crab ~ 235 cps [J1], 249 cps [J2]); B = 10-25 keV (1 Crab ~ 74 cps [J1], 70 cps [J2]). NOTES: The object marked as SLX 1744-299_300 is used to indicate two low-mass x-ray binaries separated by 2.7 arcminutes, SLX 1744-299 and SLX 1744-300; the position for SLX 1744-299 is used, although it can not be ruled out that SLX 1744-300 may dominate the emission some of the time. The systematic noise increases towards the edge of the field of view and in the vicinity of very bright sources, such as GX 5-1;
NEW SOURCEs < 6σ towards the border of the image and/or near GX 5-1 may, therefore, be spurious.
JEM-X1 Detected Sources in 3-10 keV (A) and 10-25 keV (B).
Source Name             RA       dec      l        b     A(cps)  +/-   sig  B(cps)  +/-   sig
==================== ========  ======= ======== ======== ====== ===== ===== ====== ===== =====
1A 1742-294           266.525  -29.509  359.565   -0.388   16.8  0.69  24.4    2.7  0.35   7.9
1E 1743.1-2843        266.587  -28.729    0.260   -0.029    2.7  0.74   3.7    0.0  0.00   0.0
4U 1722-30            261.888  -30.802  356.320   +2.298    5.3  1.50   3.6    2.0  0.87   2.3
GRS 1739-278          265.671  -27.742    0.679   +1.176   49.5  1.02  48.7    0.0  0.00   0.0
GX 3+1                266.986  -26.553    2.304   +0.797   76.1  1.41  53.8    8.9  0.63  14.3
GX 354-0              262.989  -33.835  354.302   -0.150   20.5  2.06  10.0    5.9  1.34   4.5
GX 5-1                270.290  -25.068    5.090   -1.018  206.2  4.39  47.0   20.3  1.93  10.5
SLX 1744-299_300      266.858  -29.999  359.297   -0.889    2.0  0.66   3.1    0.8  0.35   2.3
CONFUSED ID           270.295  -25.074    5.087   -1.024  209.2  4.40  47.5   20.9  1.93  10.8
CONFUSED ID           270.289  -24.956    5.187   -0.961   33.5  4.32   7.8    3.2  2.02   1.6
NEW SOURCE            268.035  -24.106    4.892   +1.239   26.2  4.89   5.3    3.3  2.41   1.4
NEW SOURCE            264.660  -23.885    3.475   +3.987   37.3  7.50   5.0    0.0  0.00   0.0
NEW SOURCE            267.954  -27.245    2.153   -0.299    5.6  1.08   5.3    0.9  0.51   1.8
NEW SOURCE            270.435  -25.599    4.693   -1.394   15.0  3.31   4.5    2.8  1.52   1.8
NEW SOURCE            266.463  -24.035    4.214   +2.506   22.9  4.47   5.1    0.0  0.00   0.0
NEW SOURCE            267.420  -25.292    3.586   +1.112    9.8  1.99   4.9    0.0  0.00   0.0
NEW SOURCE            266.653  -23.698    4.592   +2.532   23.7  5.03   4.7    3.2  2.68   1.2