INTEGRAL Galactic bulge Monitoring
Revolution 1446: Observation start 2014-08-18T01:17 = MJD 56887.054
Total Observation GTI = 12248 seconds
IBIS/ISGRI
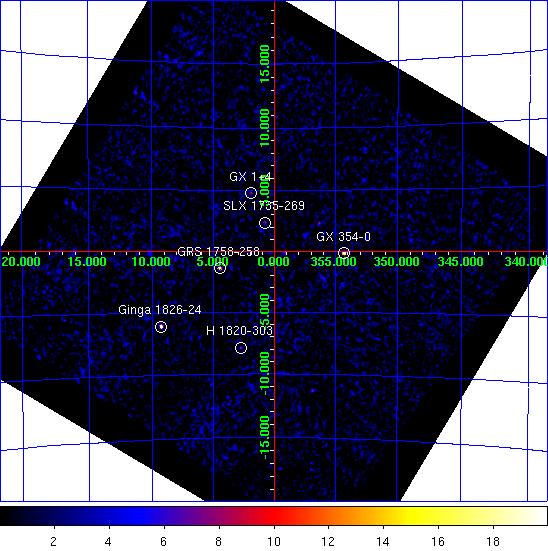
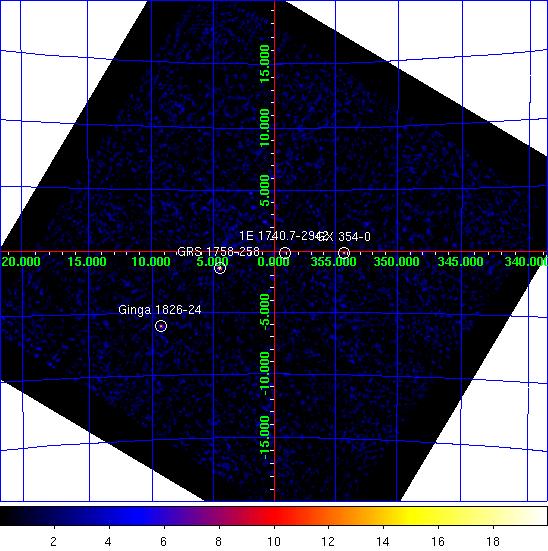
IBIS/ISGRI significance mosaic images. Left: IBIS/ISGRI 18-40 keV. Right: 40-100 keV
Sources detected > 10σ in each band are marked on the image. The table below lists the fitted position, and statistical positional uncertainty in arcmin returned by the mosaic step of
OSA10.1, of all the sources detected in the 18 - 40 keV range (band A: 1 Crab ~ 208 cps ) and 40 - 100 keV range (band B: 1 Crab ~ 100 cps ) where available.NOTES: The table is constructed from the
isgri_mosa_res.fits file - fluxes in the mosaic output are known to be systematically ~10% lower than in the ScW light-curves (see known issues). The systematic noise increases towards the edge of the field of view and NEW SOURCEs < 6σ towards the border of the image may be spurious. IBIS/ISGRI Detected Sources 18-40 keV (A) and 40-100 keV (B)
Source Name             RA       dec   +/-    l        b     A(cps)  +/-   sig  B(cps)  +/-   sig
==================== ========  ======= === ======== ======== ====== ===== ===== ====== ===== =====
GRS 1758-258          270.299  -25.754 0.9    4.498   -1.364   12.7  0.38  33.7    8.9  0.26  34.3
GX 354-0              262.978  -33.838 0.9  354.294   -0.144   13.6  0.39  35.0    4.3  0.27  15.9
Ginga 1826-24         277.370  -23.803 1.0    9.268   -6.092   16.1  0.54  29.9    5.5  0.36  15.4
GX 1+4                263.009  -24.763 2.6    1.923   +4.785    3.8  0.36  10.3    0.0  0.00   0.0
SLX 1735-269          264.590  -27.030 2.5    0.775   +2.367    3.6  0.34  10.6    1.7  0.23   7.5
4U 1722-30            261.908  -30.808 2.9  356.324   +2.280    3.4  0.38   9.1    1.1  0.26   4.5
H 1820-303            275.894  -30.374 2.6    2.767   -7.900    4.6  0.44  10.3    0.0  0.00   0.0
1E 1740.7-2942        266.022  -29.724 2.7  359.153   -0.127    3.2  0.34   9.6    2.6  0.25  10.5
GX 5-1                270.255  -25.135 2.8    5.015   -1.024    3.3  0.35   9.4    0.0  0.00   0.0
3A 1822-371           276.460  -37.123 3.1  356.839  -11.310    5.1  0.61   8.4    0.0  0.00   0.0
SAX J1806.5-2215      271.565  -22.277 0.0    8.094   -0.662    2.8  0.00   6.5    0.0  0.00   0.0
GX 349+2              256.363  -36.403 4.5  349.084   +2.807    4.1  0.73   5.6    0.0  0.00   0.0
SAX J1712.6-3739      258.162  -37.660 4.3  348.931   +0.905    4.1  0.70   5.8    0.0  0.00   0.0
GX 9+1                270.297  -20.607 5.0    8.968   +1.187    2.2  0.45   5.0    0.0  0.00   0.0
Swift J1734.5-3027    263.675  -30.374 0.0  357.522   +1.246    1.8  0.00   4.8    0.0  0.00   0.0
RX J1718.4-4029       259.532  -40.502 0.0  347.239   -1.615    4.2  0.00   4.7    0.0  0.00   0.0
IGR J16316-4028       247.880  -40.414 5.7  341.728   +5.327   49.0 11.43   4.3    0.0  0.00   0.0
GRS 1734-292          264.475  -29.164 0.0  358.916   +1.313    1.4  0.00   4.2    0.0  0.00   0.0
GRO J1655-40          253.418  -39.903 5.7  344.898   +2.469    6.6  1.56   4.3    0.0  0.00   0.0
JEM-X
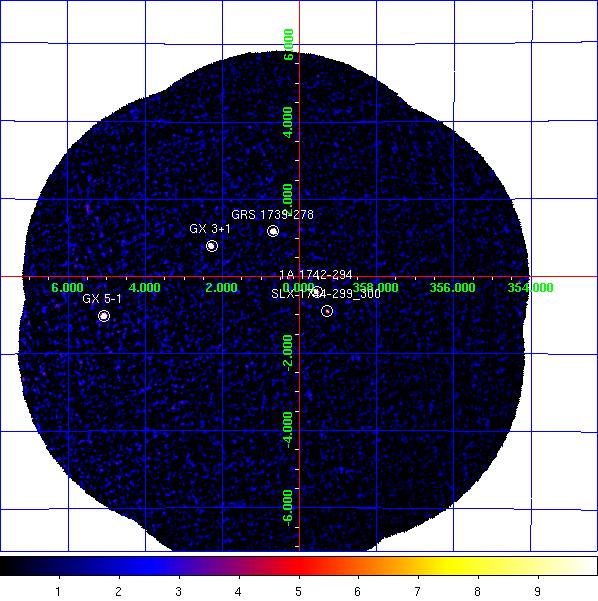
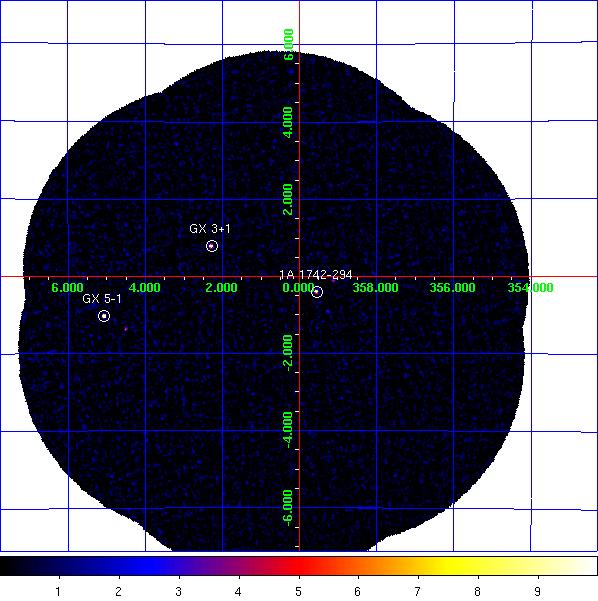
JEM-X1+2 combined significance mosaic images. Left: 3-10 keV. Right: 10-25 keV.
Sources labelled were detected in the 3-10 keV image > 6σ. The sources detected above 3σ in the 3-10 keV and/or 10-25 keV band are listed in the table below. Fluxes are extracted at the known catalogue position of the source (i.e. no fitting of the source position is done), with
mosaic_spec, in two bands: A = 3-10 keV (1 Crab ~ 97 cps [J1], 103 cps [J2]); B = 10-25 keV (1 Crab ~ 29 cps [J1], 27 cps [J2]). NOTES: The object marked as SLX 1744-299_300 is used to indicate two low-mass x-ray binaries separated by 2.7 arcminutes, SLX 1744-299 and SLX 1744-300; the position for SLX 1744-299 is used, although it can not be ruled out that SLX 1744-300 may dominate the emission some of the time. The systematic noise increases towards the edge of the field of view and in the vicinity of very bright sources, such as GX 5-1;
NEW SOURCEs < 6σ towards the border of the image and/or near GX 5-1 may, therefore, be spurious.
JEM-X1+2 Detected Sources in 3-10 keV (A) and 10-25 keV (B).
Source Name             RA       dec      l        b     A(cps)  +/-   sig  B(cps)  +/-   sig
==================== ========  ======= ======== ======== ====== ===== ===== ====== ===== =====
1A 1742-294           266.531  -29.528  359.552   -0.402    8.1  0.26  30.9    1.5  0.13  12.0
1E 1740.7-2942        265.978  -29.745  359.116   -0.106    0.8  0.27   2.9    0.6  0.13   4.4
1E 1743.1-2843        266.587  -28.729    0.260   -0.029    1.5  0.27   5.4    0.2  0.13   1.5
GRS 1739-278          265.676  -27.745    0.679   +1.170   29.5  0.35  84.5    0.2  0.15   1.1
GRS 1741.9-2853       266.260  -28.914  359.953   +0.120    1.4  0.27   5.3    0.0  0.00   0.0
GRS 1758-258          270.303  -25.741    4.511   -1.361    1.2  0.60   2.1    1.2  0.26   4.7
GX 3+1                266.975  -26.568    2.286   +0.798   29.1  0.39  74.6    3.0  0.16  18.2
GX 354-0              262.989  -33.835  354.302   -0.150   10.5  2.27   4.6    3.2  1.51   2.1
GX 5-1                270.289  -25.076    5.082   -1.021   99.2  0.91 108.5    6.7  0.35  19.1
SLX 1744-299_300      266.858  -29.999  359.297   -0.889    1.9  0.25   7.4    0.3  0.13   2.0
NEW SOURCE            267.858  -23.312    5.491   +1.783    7.7  1.43   5.4    0.0  0.00   0.0
NEW SOURCE            272.551  -24.454    6.629   -2.510   10.3  2.40   4.3    1.6  1.26   1.3
NEW SOURCE            271.758  -25.148    5.672   -2.215    5.1  1.21   4.3    0.8  0.54   1.5
NEW SOURCE            270.687  -23.906    6.278   -0.757    7.4  1.53   4.9    0.0  0.00   0.0
NEW SOURCE            269.833  -24.890    5.038   -0.570    3.6  0.78   4.6    0.4  0.33   1.4