INTEGRAL Galactic bulge Monitoring
Revolution 1404: Observation start 1999-12-31T23:58 = MJD 51544
Total Observation GTI = 10373 seconds
IBIS/ISGRI
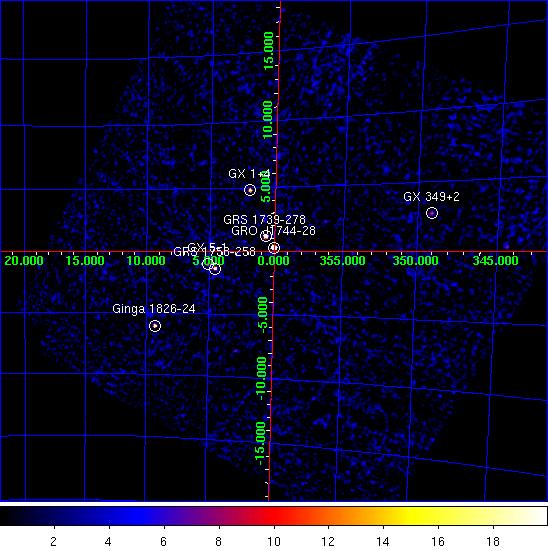
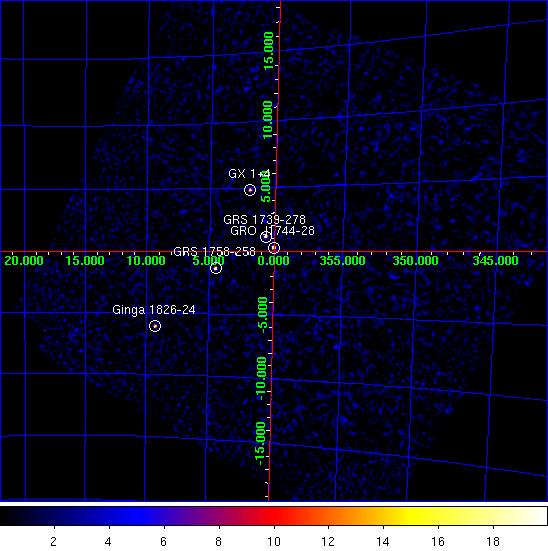
IBIS/ISGRI significance mosaic images. Left: IBIS/ISGRI 18-40 keV. Right: 40-100 keV
Sources detected > 10σ in each band are marked on the image. The table below lists the fitted position, and statistical positional uncertainty in arcmin returned by the mosaic step of
OSA10.1, of all the sources detected in the 18 - 40 keV range (band A: 1 Crab ~ 208 cps ) and 40 - 100 keV range (band B: 1 Crab ~ 100 cps ) where available.NOTES: The table is constructed from the
isgri_mosa_res.fits file - fluxes in the mosaic output are known to be systematically ~10% lower than in the ScW light-curves (see known issues). The systematic noise increases towards the edge of the field of view and NEW SOURCEs < 6σ towards the border of the image may be spurious. IBIS/ISGRI Detected Sources 18-40 keV (A) and 40-100 keV (B)
Source Name             RA       dec   +/-    l        b     A(cps)  +/-   sig  B(cps)  +/-   sig
==================== ========  ======= === ======== ======== ====== ===== ===== ====== ===== =====
GRO J1744-28          266.138  -28.742 0.3    0.044   +0.301   79.7  0.38 209.4    9.3  0.24  38.4
GRS 1739-278          265.666  -27.745 0.6    0.674   +1.178   29.1  0.43  67.9    8.4  0.27  30.9
GX 1+4                263.016  -24.745 1.1    1.941   +4.790   12.7  0.44  28.8    0.0  0.00   0.0
Ginga 1826-24         277.339  -23.774 1.1    9.281   -6.054   21.1  0.79  26.7    9.4  0.46  20.5
GRS 1758-258          270.315  -25.724 1.2    4.531   -1.362   11.5  0.45  25.7    8.8  0.27  32.5
GX 5-1                270.288  -25.088 1.5    5.071   -1.026    8.9  0.48  18.7    0.0  0.00   0.0
GX 349+2              256.435  -36.439 2.2  349.091   +2.739    8.9  0.73  12.2    0.0  0.00   0.0
OAO 1657-415          255.218  -41.585 3.3  344.431   +0.355   17.4  2.22   7.9    0.0  0.00   0.0
H 1820-303            275.936  -30.370 3.0    2.787   -7.931    5.6  0.65   8.7    0.0  0.00   0.0
SLX 1735-269          264.512  -26.974 3.2    0.785   +2.456    3.3  0.41   8.0    1.6  0.26   6.3
GX 354-0              262.976  -33.822 3.3  354.307   -0.134    3.7  0.47   7.8    0.0  0.00   0.0
GX 3+1                267.003  -26.569 3.4    2.299   +0.776    3.3  0.43   7.5    0.0  0.00   0.0
4U 1722-30            261.890  -30.840 3.5  356.289   +2.276    3.5  0.48   7.3    1.3  0.29   4.7
3A 1822-371           276.460  -37.179 3.7  356.788  -11.333    6.0  0.88   6.9    0.0  0.00   0.0
1E 1740.7-2942        265.980  -29.767 0.0  359.099   -0.118    2.6  0.00   6.7    0.0  0.00   0.0
IGR J18027-1455       270.648  -14.914 4.3   14.092   +3.701   10.8  1.84   5.9    0.0  0.00   0.0
IGR J17494-3030       267.348  -30.578 5.2  359.019   -1.550    1.9  0.41   4.7    0.0  0.00   0.0
SAX J1810.8-2609      272.769  -26.140 0.0    5.243   -3.492    2.4  0.00   4.8    0.0  0.00   0.0
MAXI J1836-194        278.969  -19.354 3.9   13.931   -5.402    9.9  1.53   6.5    0.0  0.00   0.0
XTE J1719-291         259.914  -29.000 4.8  356.848   +4.727    2.6  0.52   5.1    0.0  0.00   0.0
XTE J1710-281         257.464  -28.129 4.9  356.314   +6.986    2.9  0.57   5.1    0.0  0.00   0.0
IGR J17252-3616       261.391  -36.273 5.4  351.547   -0.411    2.6  0.58   4.5    0.0  0.00   0.0
XMMSL1 J171900.4-353  259.766  -35.607 5.7  351.349   +1.050    2.5  0.00   4.3    0.0  0.00   0.0
IGR J17407-2808       265.233  -28.154 0.0    0.125   +1.287    1.8  0.00   4.2    0.0  0.00   0.0
1E 1742.9-2849        266.575  -28.907 0.0    0.103   -0.112    1.7  0.00   4.1    0.0  0.00   0.0
Swift J175648.6-2544  269.238  -25.852 5.9    3.936   -0.585    2.0  0.00   4.1    0.0  0.00   0.0
GRS 1734-292          264.283  -29.122 0.0  358.861   +1.476    1.6  0.00   4.0    0.0  0.00   0.0
NEW SOURCE            268.396  -24.280 4.5    4.908   +0.867    2.4  0.43   5.6    0.0  0.00   0.0
NEW SOURCE            260.056  -37.920 4.4  349.587   -0.465    3.5  0.62   5.7    0.0  0.00   0.0
NEW SOURCE            253.201  -28.701 3.8  353.567   +9.631    5.7  0.85   6.6    0.0  0.00   0.0
NEW SOURCE            278.679  -24.180 4.1    9.471   -7.330    6.4  1.05   6.1    0.0  0.00   0.0
NEW SOURCE            273.865  -27.036 4.6    4.919   -4.780    2.8  0.52   5.4    0.0  0.00   0.0
JEM-X
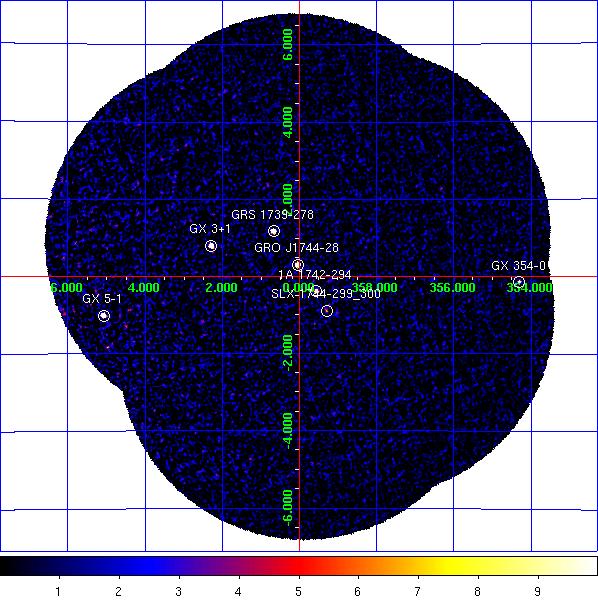
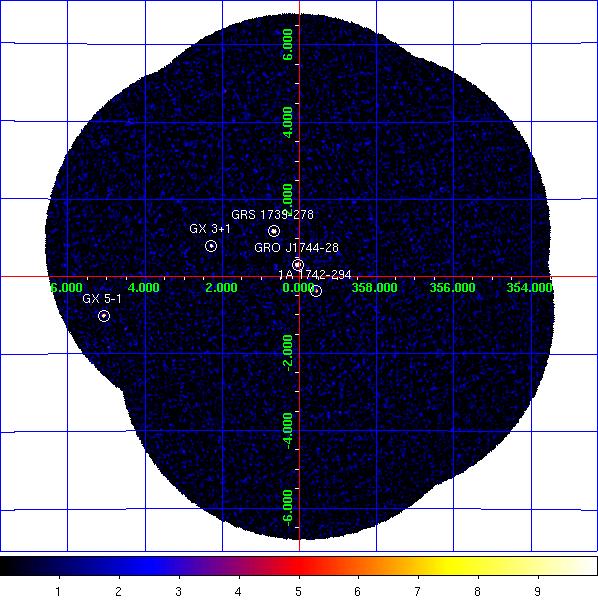
JEM-X1+2 combined significance mosaic images. Left: 3-10 keV. Right: 10-25 keV.
Sources labelled were detected in the 3-10 keV image > 6σ. The sources detected above 3σ in the 3-10 keV and/or 10-25 keV band are listed in the table below. Fluxes are extracted at the known catalogue position of the source (i.e. no fitting of the source position is done), with
mosaic_spec, in two bands: A = 3-10 keV (1 Crab ~ 97 cps [J1], 103 cps [J2]); B = 10-25 keV (1 Crab ~ 29 cps [J1], 27 cps [J2]). NOTES: The object marked as SLX 1744-299_300 is used to indicate two low-mass x-ray binaries separated by 2.7 arcminutes, SLX 1744-299 and SLX 1744-300; the position for SLX 1744-299 is used, although it can not be ruled out that SLX 1744-300 may dominate the emission some of the time. The systematic noise increases towards the edge of the field of view and in the vicinity of very bright sources, such as GX 5-1;
NEW SOURCEs < 6σ towards the border of the image and/or near GX 5-1 may, therefore, be spurious.
JEM-X1+2 Detected Sources in 3-10 keV (A) and 10-25 keV (B).
Source Name             RA       dec      l        b     A(cps)  +/-   sig  B(cps)  +/-   sig
==================== ========  ======= ======== ======== ====== ===== ===== ====== ===== =====
1A 1742-294           266.523  -29.515  359.559   -0.389    9.8  0.34  28.3    1.3  0.18   7.1
4U 1722-30            261.888  -30.802  356.320   +2.298    2.3  0.65   3.5    1.0  0.39   2.5
GRO J1744-28          266.141  -28.741    0.045   +0.299   43.2  0.38 114.7   20.8  0.20 102.1
GRS 1739-278          265.668  -27.748    0.673   +1.175   42.0  0.42 100.7    7.9  0.21  38.7
GX 1+4                263.009  -24.746    1.937   +4.795    5.1  1.14   4.5    2.4  0.60   3.9
GX 3+1                266.979  -26.561    2.293   +0.798   49.1  0.52  94.8    3.8  0.24  15.4
GX 354-0              262.989  -33.835  354.302   -0.150   23.1  1.29  17.9    3.4  0.85   4.0
GX 5-1                270.284  -25.079    5.077   -1.019  169.1  2.86  59.2   15.4  1.25  12.3
SLX 1744-299_300      266.858  -29.999  359.297   -0.889    2.1  0.33   6.3    0.0  0.00   0.0
NEW SOURCE            271.017  -25.573    4.974   -1.838   18.4  3.21   5.7    3.0  1.95   1.5
NEW SOURCE            270.225  -25.714    4.499   -1.286    7.2  1.55   4.7    0.0  0.00   0.0
NEW SOURCE            269.007  -27.372    2.518   -1.170    2.8  0.55   5.0    0.3  0.29   1.2
NEW SOURCE            269.436  -23.447    6.108   +0.465   13.8  3.07   4.5    0.0  0.00   0.0
NEW SOURCE            269.781  -25.582    4.415   -0.874    6.0  1.34   4.5    0.0  0.00   0.0