INTEGRAL Galactic bulge Monitoring
Revolution 1389: Observation start 2014-03-01T12:25 = MJD 56717.518
Total Observation GTI = 10769 seconds
IBIS/ISGRI
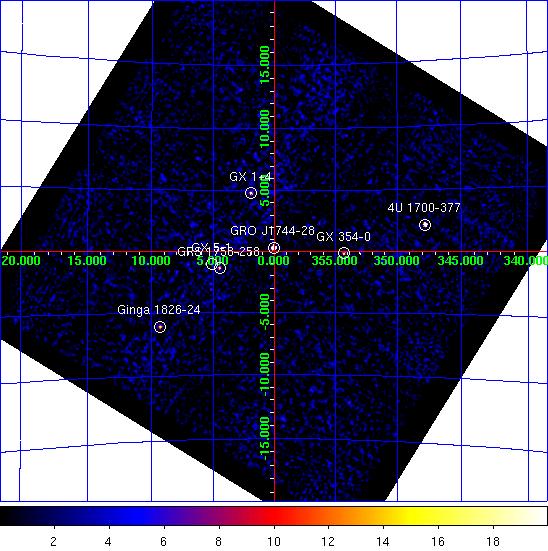

IBIS/ISGRI significance mosaic images. Left: IBIS/ISGRI 18-40 keV. Right: 40-100 keV
Sources detected > 10σ in each band are marked on the image. The table below lists the fitted position, and statistical positional uncertainty in arcmin returned by the mosaic step of
OSA10.1, of all the sources detected in the 18 - 40 keV range (band A: 1 Crab ~ 208 cps ) and 40 - 100 keV range (band B: 1 Crab ~ 100 cps ) where available.NOTES: The table is constructed from the
isgri_mosa_res.fits file - fluxes in the mosaic output are known to be systematically ~10% lower than in the ScW light-curves (see known issues). The systematic noise increases towards the edge of the field of view and NEW SOURCEs < 6σ towards the border of the image may be spurious. IBIS/ISGRI Detected Sources 18-40 keV (A) and 40-100 keV (B)
Source Name             RA       dec   +/-    l        b     A(cps)  +/-   sig  B(cps)  +/-   sig
==================== ========  ======= === ======== ======== ====== ===== ===== ====== ===== =====
GRO J1744-28          266.135  -28.743 0.3    0.042   +0.303  100.9  0.45 225.5   10.9  0.29  37.4
4U 1700-377           255.996  -37.839 0.6  347.763   +2.171   65.6  1.05  62.7   22.8  0.63  36.3
GX 1+4                263.009  -24.758 1.2    1.927   +4.788   13.9  0.57  24.3    0.0  0.00   0.0
GRS 1758-258          270.294  -25.742 1.4    4.505   -1.354   11.7  0.58  20.4    7.3  0.35  20.7
Ginga 1826-24         277.394  -23.768 1.6    9.310   -6.096   17.7  0.97  18.2    6.4  0.57  11.2
GX 354-0              262.990  -33.850 1.6  354.290   -0.159    9.9  0.55  17.9    3.0  0.35   8.7
GX 5-1                270.310  -25.064 2.1    5.101   -1.031    8.1  0.61  13.3    0.0  0.00   0.0
3A 1822-371           276.354  -37.025 4.1  356.892  -11.191    6.6  1.08   6.1    0.0  0.00   0.0
4U 1722-30            261.816  -30.813 3.5  356.276   +2.344    3.9  0.53   7.4    0.0  0.00   0.0
Swift J174444.9-2950  266.217  -29.745 4.1  359.225   -0.282    2.9  0.00   6.1    0.0  0.00   0.0
GX 349+2              256.427  -36.391 3.4  349.125   +2.773    6.8  0.90   7.5    0.0  0.00   0.0
SLX 1735-269          264.565  -27.008 4.2    0.782   +2.398    2.9  0.48   6.0    0.0  0.00   0.0
IGR J17252-3616       261.425  -36.311 4.9  351.532   -0.455    3.5  0.69   5.1    0.0  0.00   0.0
1RXS J175721.2-30440  269.449  -30.723 4.3  359.809   -3.182    3.0  0.52   5.8    0.0  0.00   0.0
GX 3+1                267.030  -26.532 0.0    2.343   +0.774    2.4  0.00   5.2    0.0  0.00   0.0
H 1702-429            256.526  -43.025 5.0  343.879   -1.290   18.1  3.62   5.0    0.0  0.00   0.0
1RXS J180408.9-34205  271.065  -34.384 4.5  357.277   -6.165    3.5  0.63   5.6    0.0  0.00   0.0
NEW SOURCE            263.427  -26.749 4.7    0.454   +3.393    2.6  0.48   5.3    0.0  0.00   0.0