INTEGRAL Galactic bulge Monitoring
Revolution 1326: Observation start 1999-12-31T23:58 = MJD 51544
Total Observation GTI = 14301 seconds
IBIS/ISGRI
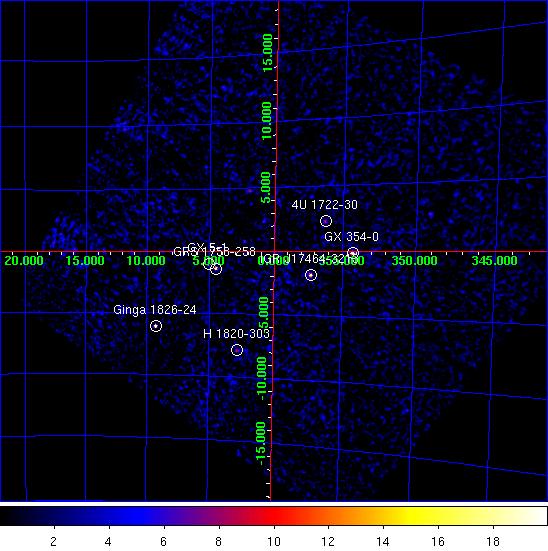
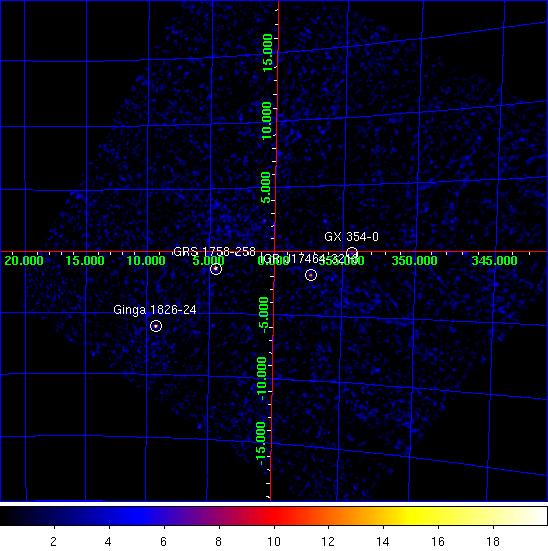
IBIS/ISGRI significance mosaic images. Left: IBIS/ISGRI 18-40 keV. Right: 40-100 keV
Sources detected > 10σ in each band are marked on the image. The table below lists the fitted position, and statistical positional uncertainty in arcmin returned by the mosaic step of
OSA10.1, of all the sources detected in the 18 - 40 keV range (band A: 1 Crab ~ 208 cps ) and 40 - 100 keV range (band B: 1 Crab ~ 100 cps ) where available.NOTES: The table is constructed from the
isgri_mosa_res.fits file - fluxes in the mosaic output are known to be systematically ~10% lower than in the ScW light-curves (see known issues). The systematic noise increases towards the edge of the field of view and NEW SOURCEs < 6σ towards the border of the image may be spurious. IBIS/ISGRI Detected Sources 18-40 keV (A) and 40-100 keV (B)
Source Name             RA       dec   +/-    l        b     A(cps)  +/-   sig  B(cps)  +/-   sig
==================== ========  ======= === ======== ======== ====== ===== ===== ====== ===== =====
GX 354-0              262.975  -33.832 1.0  354.298   -0.139   10.7  0.35  30.7    2.7  0.23  11.5
GRS 1758-258          270.306  -25.757 1.1    4.498   -1.372    8.3  0.31  26.9    6.3  0.21  29.7
Ginga 1826-24         277.374  -23.788 1.2    9.283   -6.089   17.8  0.68  26.2    8.0  0.44  18.2
IGR J17464-3213       266.574  -32.226 1.5  357.265   -1.836    6.2  0.32  19.6    3.2  0.22  14.1
GX 5-1                270.273  -25.088 1.4    5.065   -1.014    8.6  0.40  21.3    0.0  0.00   0.0
4U 1722-30            261.851  -30.833 2.5  356.276   +2.308    3.2  0.30  10.5    1.3  0.21   6.2
H 1820-303            275.867  -30.412 2.5    2.722   -7.897    4.7  0.45  10.4    0.0  0.00   0.0
GX 1+4                263.041  -24.750 2.7    1.949   +4.768    3.5  0.36   9.7    0.0  0.00   0.0
GX 349+2              256.488  -36.476 3.2  349.086   +2.683    4.3  0.53   8.1    0.0  0.00   0.0
GX 3+1                266.983  -26.565 3.2    2.292   +0.793    2.6  0.33   7.9    0.0  0.00   0.0
GX 13+1               273.721  -17.200 3.3   13.520   +0.011    6.7  0.84   7.9    0.0  0.00   0.0
SLX 1735-269          264.547  -27.002 3.6    0.778   +2.415    2.2  0.30   7.2    1.7  0.22   7.9
1A 1742-294           266.577  -29.461 3.9  359.630   -0.401    2.0  0.31   6.5    0.0  0.00   0.0
4U 1700-377           256.015  -37.808 4.4  347.797   +2.178    3.4  0.61   5.6    1.8  0.45   3.9
V745 Sco              268.920  -33.209 4.7  357.426   -4.035    1.8  0.00   5.3    0.0  0.00   0.0
SLX 1744-299_300      266.843  -30.095 0.0  359.208   -0.928    1.6  0.00   5.0    0.9  0.24   3.7
AX J1820.5-1434       275.207  -14.524 0.0   16.554   +0.021    7.3  0.00   4.7    0.0  0.00   0.0
XTE J1814-338         273.433  -33.776 4.8  358.751   -7.605    2.3  0.44   5.1    0.0  0.00   0.0
GX 17+2               273.947  -14.094 0.0   16.355   +1.300    7.8  0.00   4.4    0.0  0.00   0.0
GX 9+1                270.420  -20.524 0.0    9.097   +1.127    1.9  0.00   4.2    0.0  0.00   0.0
1RXS J170849.0-40091  257.135  -40.169 5.0  346.436   +0.060    3.9  0.80   4.9    0.0  0.00   0.0
GRS 1734-292          264.363  -29.155 5.0  358.871   +1.400    1.4  0.28   5.0    0.0  0.00   0.0
Swift J174535.5-2901  266.415  -29.031 5.7  359.924   -0.057    1.4  0.33   4.3    0.0  0.00   0.0
SLX 1737-282          265.197  -28.330 6.1  359.959   +1.221    1.1  0.00   4.0    0.0  0.00   0.0
SAX J1752.3-3138      268.071  -31.563 10.4  358.488   -2.585    0.8  0.37   2.3    0.0  0.00   0.0
KS 1741-293           266.182  -29.346 0.0  359.548   -0.048    1.1  0.00   4.0    0.0  0.00   0.0
Swift J1753.7-2544    268.439  -25.628 6.2    3.766   +0.149    1.4  0.00   3.9    0.0  0.00   0.0
NEW SOURCE            280.712  -29.861 3.9    5.079  -11.427    8.7  1.33   6.5    0.0  0.00   0.0
NEW SOURCE            264.065  -13.713 0.0   11.896   +9.814   10.4  0.00   7.1    0.0  0.00   0.0
NEW SOURCE            257.178  -18.628 3.5    4.027  +12.700    4.0  0.58   7.4    0.0  0.00   0.0
NEW SOURCE            274.765  -14.997 3.8   15.935   +0.175    9.7  1.44   6.7    0.0  0.00   0.0
NEW SOURCE            275.110  -13.236 3.4   17.645   +0.711   22.6  3.22   7.5    0.0  0.00   0.0
NEW SOURCE            250.781  -30.759 3.8  350.601   +9.960    5.2  0.69   6.6    0.0  0.00   0.0
NEW SOURCE            277.559  -20.867 0.0   11.973   -4.910    5.7  0.00   6.6    0.0  0.00   0.0
NEW SOURCE            263.745  -13.438 3.4   11.971  +10.224   11.1  1.45   7.6    0.0  0.00   0.0
NEW SOURCE            258.064  -18.429 3.9    4.682  +12.120    3.8  0.59   6.5    0.0  0.00   0.0
NEW SOURCE            274.543  -13.858 0.0   16.837   +0.904   12.1  0.00   6.3    0.0  0.00   0.0
NEW SOURCE            274.130  -13.441 0.0   17.013   +1.455   14.3  0.00   6.2    0.0  0.00   0.0
NEW SOURCE            264.116  -12.997 0.0   12.544  +10.143   13.8  0.00   6.2    0.0  0.00   0.0
NEW SOURCE            260.712  -28.921 3.8  357.311   +4.195    2.4  0.35   6.6    0.0  0.00   0.0
NEW SOURCE            256.144  -14.446 4.1    7.005  +15.884    9.0  1.40   6.2    0.0  0.00   0.0
NEW SOURCE            264.982  -19.043 3.6    7.765   +6.285    3.4  0.46   7.0    0.0  0.00   0.0
NEW SOURCE            252.869  -13.390 4.7    6.012  +19.097   17.5  3.31   5.3    0.0  0.00   0.0
NEW SOURCE            262.979  -17.458 3.9    8.110   +8.738    3.7  0.57   6.5    0.0  0.00   0.0
JEM-X
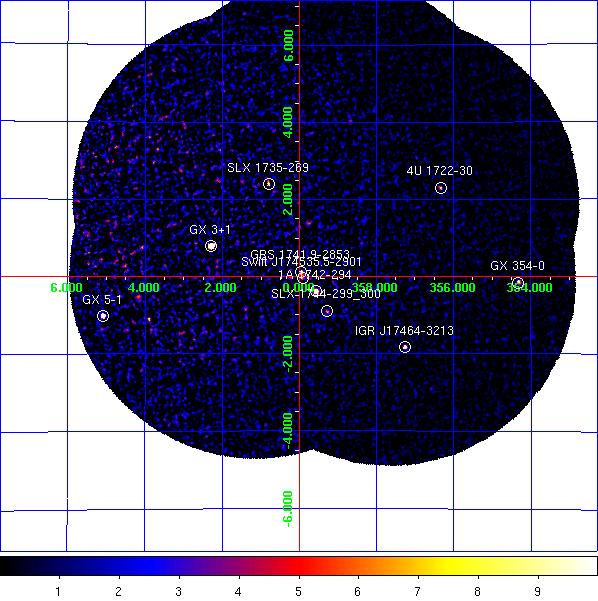
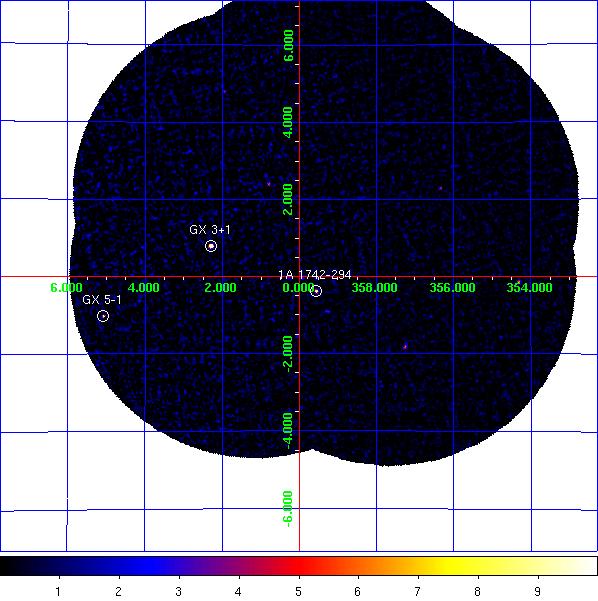
JEM-X1+2 combined significance mosaic images. Left: 3-10 keV. Right: 10-25 keV.
Sources labelled were detected in the 3-10 keV image > 6σ. The sources detected above 3σ in the 3-10 keV and/or 10-25 keV band are listed in the table below. Fluxes are extracted at the known catalogue position of the source (i.e. no fitting of the source position is done), with
mosaic_spec, in two bands: A = 3-10 keV (1 Crab ~ 97 cps [J1], 103 cps [J2]); B = 10-25 keV (1 Crab ~ 29 cps [J1], 27 cps [J2]). NOTES: The object marked as SLX 1744-299_300 is used to indicate two low-mass x-ray binaries separated by 2.7 arcminutes, SLX 1744-299 and SLX 1744-300; the position for SLX 1744-299 is used, although it can not be ruled out that SLX 1744-300 may dominate the emission some of the time. The systematic noise increases towards the edge of the field of view and in the vicinity of very bright sources, such as GX 5-1;
NEW SOURCEs < 6σ towards the border of the image and/or near GX 5-1 may, therefore, be spurious.
JEM-X1+2 Detected Sources in 3-10 keV (A) and 10-25 keV (B).
Source Name             RA       dec      l        b     A(cps)  +/-   sig  B(cps)  +/-   sig
==================== ========  ======= ======== ======== ====== ===== ===== ====== ===== =====
1A 1742-294           266.524  -29.513  359.562   -0.389    9.0  0.26  34.2    1.5  0.14  10.7
1E 1743.1-2843        266.587  -28.729    0.260   -0.029    1.3  0.25   5.2    0.4  0.13   2.9
4U 1722-30            261.888  -30.802  356.320   +2.298    2.9  0.29  10.1    0.7  0.19   3.9
GRS 1741.9-2853       266.260  -28.914  359.953   +0.120    2.4  0.23  10.1    0.2  0.12   2.0
GRS 1758-258          270.303  -25.741    4.511   -1.361    7.2  1.68   4.3    1.7  0.85   2.0
GX 1+4                263.009  -24.746    1.937   +4.795    0.4  0.39   1.1    0.7  0.23   3.2
GX 3+1                266.989  -26.562    2.298   +0.790   53.8  0.34 158.7    5.9  0.16  37.7
GX 354-0              263.015  -33.824  354.323   -0.162    8.6  0.65  13.3    2.7  0.45   6.0
GX 5-1                270.287  -25.082    5.076   -1.022   89.8  2.43  37.0    8.5  1.21   7.0
IGR J17464-3213       266.567  -32.229  357.260   -1.832    8.0  0.44  18.2    1.6  0.26   5.9
NEW SOURCE            269.838  -27.469    2.803   -1.857    2.4  0.63   3.8    0.0  0.00   0.0
SLX 1735-269          264.571  -26.994    0.796   +2.400    2.0  0.21   9.9    0.5  0.11   4.9
SLX 1744-299_300      266.858  -29.999  359.297   -0.889    1.8  0.29   6.2    0.5  0.16   3.0
Swift J174535.5-2901  266.398  -29.026  359.920   -0.042    2.0  0.24   8.7    0.4  0.13   3.5
NEW SOURCE            269.395  -25.693    4.145   -0.628    3.9  0.77   5.1    1.2  0.42   3.0
NEW SOURCE            268.524  -23.712    5.458   +1.054    6.4  1.31   4.9    2.4  0.81   3.0