INTEGRAL Galactic bulge Monitoring
Revolution 1279: Observation start 2013-04-06T00:03 = MJD 56388.003
Total Observation GTI = 12460 seconds
ISGRI
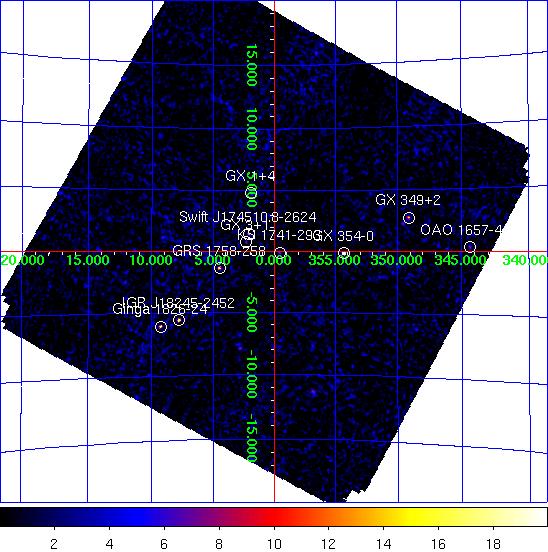
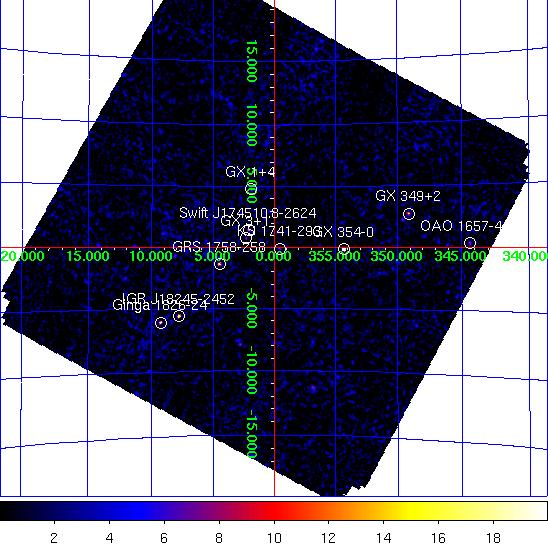
ISGRI significance mosaic images. Left: ISGRI 18-40 keV. Right: 40-100 keV
Sources detected > 10σ in each band are marked on the image. The table below lists the fitted position, and statistical positional uncertainty in arcmin returned by the mosaic step of
OSA9, of all the sources detected in the 18 - 40 keV range (band A: 1 Crab ~ 210 cps ) and 40 - 100 keV range (band B: 1 Crab ~ 104 cps ) where available.NOTES: The table is constructed from the
isgri_mosa_res.fits file - fluxes in the mosaic output are known to be systematically ~10% lower than in the ScW light-curves (see known issues). The systematic noise increases towards the edge of the field of view and NEW SOURCEs < 6σ towards the border of the image may be spurious. ISGRI Detected Sources 18-40 keV (A) and 40-100 keV (B)
Source Name             RA       dec   +/-    l        b     A(cps)  +/-   sig  B(cps)  +/-   sig
==================== ========  ======= === ======== ======== ====== ===== ===== ====== ===== =====
GX 354-0              262.990  -33.827 0.7  354.309   -0.146   20.7  0.41  50.1    6.9  0.29  23.6
GRS 1758-258          270.304  -25.747 1.2    4.506   -1.365    9.7  0.38  25.2    6.9  0.27  26.0
IGR J18245-2452       276.141  -24.863 1.4    7.806   -5.581   12.1  0.56  21.6    6.1  0.37  16.3
Ginga 1826-24         277.366  -23.783 1.4    9.284   -6.080   15.3  0.72  21.3    5.9  0.47  12.5
GX 349+2              256.450  -36.421 2.0  349.112   +2.740    9.3  0.66  14.0    0.0  0.00   0.0
GX 1+4                263.007  -24.773 1.8    1.913   +4.781    5.3  0.35  15.1    0.0  0.00   0.0
Swift J174510.8-2624  266.286  -26.399 1.8    2.111   +1.413    5.1  0.33  15.6    3.4  0.24  14.1
KS 1741-293           266.253  -29.350 2.5  359.578   -0.102    3.4  0.33  10.5    1.6  0.23   6.7
OAO 1657-415          255.184  -41.650 2.6  344.365   +0.334   27.3  2.67  10.2    0.0  0.00   0.0
H 1820-303            275.873  -30.310 3.3    2.816   -7.855    4.3  0.55   7.8    0.0  0.00   0.0
GX 3+1                267.019  -26.560 2.4    2.314   +0.769    3.5  0.32  10.9    0.0  0.00   0.0
SAX J1806.5-2215      271.615  -22.252 3.0    8.139   -0.690    3.8  0.44   8.7    1.7  0.30   5.7
SLX 1744-299_300      266.842  -29.976 2.8  359.309   -0.865    3.4  0.36   9.4    0.0  0.00   0.0
IGR J17091-3624       257.263  -36.387 2.9  349.532   +2.237    5.7  0.63   9.1    4.5  0.43  10.5
3A 1822-371           276.507  -37.156 3.0  356.825  -11.357    6.9  0.80   8.6    0.0  0.00   0.0
GX 9+1                270.405  -20.506 0.0    9.106   +1.149    3.5  0.00   7.0    0.0  0.00   0.0
SLX 1735-269          264.560  -26.989 3.4    0.796   +2.411    2.8  0.36   7.7    1.6  0.25   6.5
XTE J1739-285         265.004  -28.533 3.5  359.697   +1.257    2.7  0.36   7.4    1.1  0.25   4.6
XTE J1810-189         272.540  -19.058 3.6   11.352   +0.103    4.5  0.64   7.1    0.0  0.00   0.0
GX 5-1                270.262  -25.022 4.3    5.117   -0.973    2.1  0.36   5.8    0.0  0.00   0.0
4U 1700-377           255.995  -37.858 0.0  347.747   +2.159    4.3  0.00   5.1    0.0  0.00   0.0
NEW SOURCE            249.747  -22.491 4.5  356.530  +15.949   10.5  1.82   5.5    0.0  0.00   0.0
NEW SOURCE            275.389  -19.623 4.5   12.134   -2.530    3.8  0.68   5.6    0.0  0.00   0.0
NEW SOURCE            256.678  -40.341 3.7  346.090   +0.237    8.4  1.22   6.9    0.0  0.00   0.0
NEW SOURCE            260.508  -26.427 3.9  359.279   +5.748    2.5  0.39   6.4    0.0  0.00   0.0
NEW SOURCE            266.203  -17.007 3.9   10.122   +6.348    3.8  0.59   6.4    0.0  0.00   0.0
NEW SOURCE            265.616  -41.964 4.1  348.524   -6.242    7.8  1.26   6.2    0.0  0.00   0.0
NEW SOURCE            257.024  -21.932 3.9    1.178  +10.922    3.2  0.49   6.6    0.0  0.00   0.0
NEW SOURCE            276.863  -24.538 4.3    8.398   -6.015    3.4  0.57   5.9    0.0  0.00   0.0
NEW SOURCE            252.429  -23.915 5.4  356.968  +13.134    3.9  0.85   4.6    0.0  0.00   0.0
JEM-X
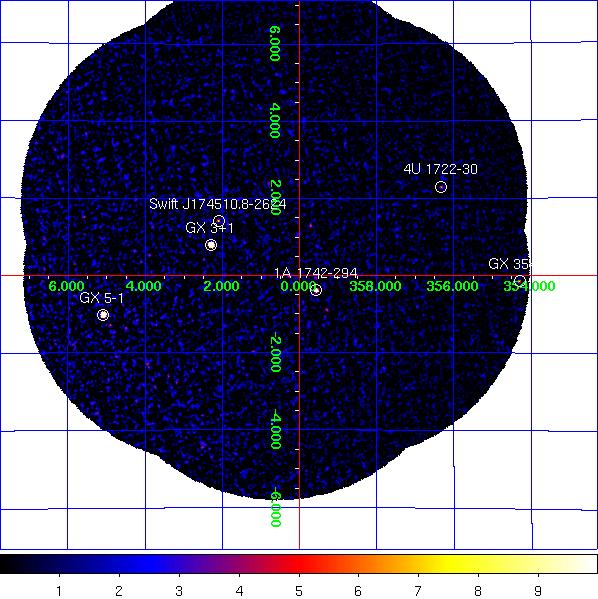
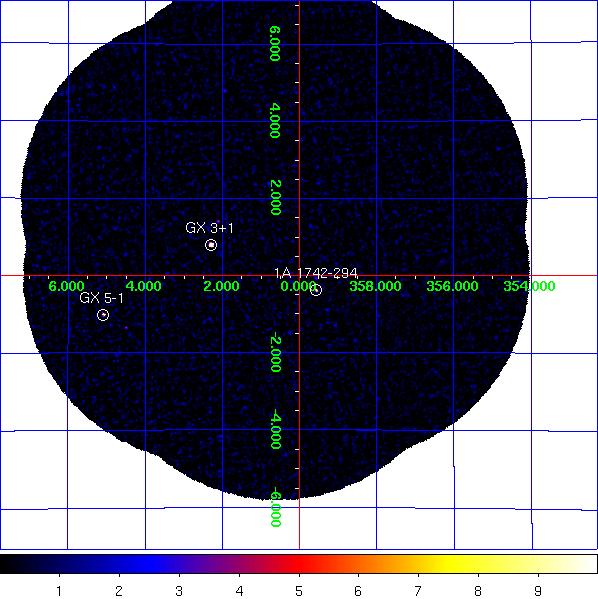
JEM-X1+2 combined significance mosaic images. Left: 3-10 keV. Right: 10-25 keV.
Sources labelled were detected in the 3-10 keV image > 6σ. The sources detected above 3σ in the 3-10 keV and/or 10-25 keV band are listed in the table below. Fluxes are extracted at the known catalogue position of the source (i.e. no fitting of the source position is done), with
mosaic_spec, in two bands: A = 3-10 keV (1 Crab ~ 235 cps [J1], 249 cps [J2]); B = 10-25 keV (1 Crab ~ 74 cps [J1], 70 cps [J2]). NOTES: The object marked as SLX 1744-299_300 is used to indicate two low-mass x-ray binaries separated by 2.7 arcminutes, SLX 1744-299 and SLX 1744-300; the position for SLX 1744-299 is used, although it can not be ruled out that SLX 1744-300 may dominate the emission some of the time. The systematic noise increases towards the edge of the field of view and in the vicinity of very bright sources, such as GX 5-1;
NEW SOURCEs < 6σ towards the border of the image and/or near GX 5-1 may, therefore, be spurious.
JEM-X1+2 Detected Sources in 3-10 keV (A) and 10-25 keV (B).
Source Name             RA       dec      l        b     A(cps)  +/-   sig  B(cps)  +/-   sig
==================== ========  ======= ======== ======== ====== ===== ===== ====== ===== =====
1A 1742-294           266.523  -29.515  359.559   -0.389   15.7  0.52  30.3    2.4  0.27   8.9
1E 1743.1-2843        266.587  -28.729    0.260   -0.029    2.8  0.48   5.9    0.4  0.25   1.6
4U 1722-30            261.888  -30.802  356.320   +2.298    5.7  0.93   6.2    0.0  0.00   0.0
GRS 1758-258          270.303  -25.741    4.511   -1.361    6.8  1.49   4.6    2.4  0.70   3.5
GX 3+1                266.983  -26.568    2.290   +0.792  114.5  0.66 174.4   12.5  0.29  43.3
GX 354-0              262.989  -33.835  354.302   -0.150   24.4  3.61   6.8    9.1  2.99   3.0
GX 5-1                270.298  -25.069    5.092   -1.024  197.8  2.15  91.9    8.3  0.85   9.7
SLX 1735-269          264.571  -26.994    0.796   +2.400    2.2  0.45   4.7    0.7  0.24   2.9
SLX 1744-299_300      266.858  -29.999  359.297   -0.889    2.8  0.56   5.0    0.7  0.31   2.4
XTE J1739-285         264.975  -28.496  359.714   +1.298    2.6  0.46   5.6    0.6  0.24   2.3
Swift J174510.8-2624  266.278  -26.404    2.103   +1.416    4.1  0.51   8.0    1.1  0.25   4.4
NEW SOURCE            270.895  -26.690    3.946   -2.291    8.3  1.50   5.6    0.0  0.00   0.0
KS 1741-293           266.214  -29.332  359.576   -0.064    2.3  0.47   5.0    1.0  0.26   3.7
NEW SOURCE            268.161  -23.359    5.593   +1.519    8.3  1.77   4.7    0.0  0.00   0.0