INTEGRAL Galactic bulge Monitoring
Revolution 1223: Observation start 2012-10-18T15:25 = MJD 56218.643
Total Observation GTI = 15547 seconds
IBIS/ISGRI
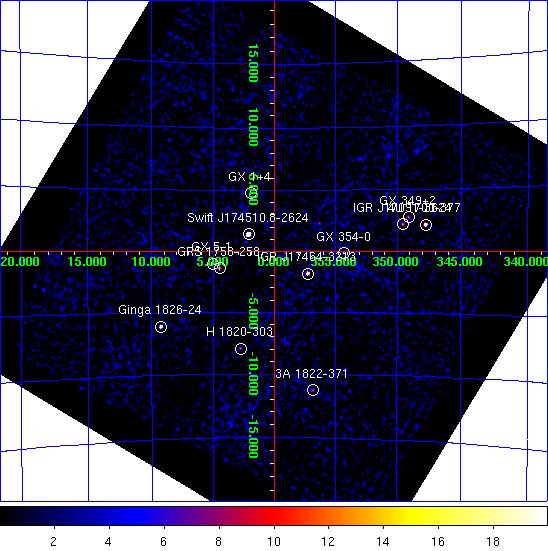
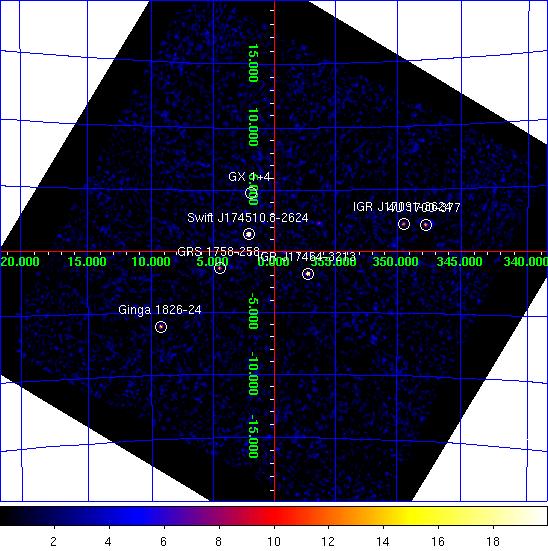
IBIS/ISGRI significance mosaic images. Left: IBIS/ISGRI 18-40 keV. Right: 40-100 keV
Sources detected > 10σ in each band are marked on the image. The table below lists the fitted position, and statistical positional uncertainty in arcmin returned by the mosaic step of
OSA10.1, of all the sources detected in the 18 - 40 keV range (band A: 1 Crab ~ 208 cps ) and 40 - 100 keV range (band B: 1 Crab ~ 100 cps ) where available.NOTES: The table is constructed from the
isgri_mosa_res.fits file - fluxes in the mosaic output are known to be systematically ~10% lower than in the ScW light-curves (see known issues). The systematic noise increases towards the edge of the field of view and NEW SOURCEs < 6σ towards the border of the image may be spurious. IBIS/ISGRI Detected Sources 18-40 keV (A) and 40-100 keV (B)
Source Name             RA       dec   +/-    l        b     A(cps)  +/-   sig  B(cps)  +/-   sig
==================== ========  ======= === ======== ======== ====== ===== ===== ====== ===== =====
Swift J174510.8-2624  266.298  -26.402 0.3    2.113   +1.402   61.8  0.34 183.7   25.8  0.24 107.0
IGR J17464-3213       266.562  -32.226 0.8  357.260   -1.827   14.3  0.36  40.1   10.5  0.25  41.1
GX 5-1                270.288  -25.079 0.9    5.079   -1.022   12.5  0.36  34.6    0.0  0.00   0.0
4U 1700-377           255.991  -37.854 0.9  347.749   +2.165   23.1  0.68  33.9    7.2  0.45  15.8
Ginga 1826-24         277.364  -23.805 1.2    9.264   -6.089   14.8  0.58  25.6    6.8  0.38  17.7
GX 1+4                263.023  -24.748 1.3    1.941   +4.783    8.7  0.39  22.6    0.0  0.00   0.0
GRS 1758-258          270.315  -25.741 1.5    4.515   -1.370    6.4  0.35  18.4    4.7  0.24  19.1
GX 354-0              262.961  -33.835 1.8  354.290   -0.131    5.9  0.38  15.4    0.9  0.27   3.4
IGR J17091-3624       257.284  -36.389 1.9  349.541   +2.222    8.6  0.58  14.8    5.7  0.40  14.2
H 1820-303            275.940  -30.372 2.0    2.787   -7.934    6.3  0.46  13.6    0.0  0.00   0.0
GX 349+2              256.426  -36.434 2.2  349.090   +2.748    7.5  0.60  12.5    0.0  0.00   0.0
3A 1822-371           276.418  -37.093 2.3  356.852  -11.266    6.8  0.58  11.8    0.0  0.00   0.0
4U 1722-30            261.905  -30.795 2.7  356.333   +2.290    3.5  0.37   9.6    2.1  0.25   8.2
1E 1740.7-2942        266.054  -29.750 2.9  359.146   -0.164    2.8  0.31   9.1    1.9  0.23   8.4
GX 3+1                267.009  -26.571 3.6    2.299   +0.770    2.6  0.36   7.1    0.0  0.00   0.0
1A 1742-294           266.528  -29.593 0.0  359.495   -0.434    2.1  0.00   6.9    0.0  0.00   0.0
XTE J1814-338         273.393  -33.704 0.0  358.800   -7.542    2.4  0.00   6.1    0.0  0.00   0.0
IGR J18027-1455       270.684  -14.977 4.7   14.054   +3.640    9.4  1.77   5.3    0.0  0.00   0.0
3A 1728-169           263.015  -16.995 4.1    8.526   +8.954    5.4  0.88   6.1    0.0  0.00   0.0
SAX J1806.5-2215      271.677  -22.242 5.2    8.175   -0.736    2.2  0.00   4.8    1.5  0.32   4.8
SAX J1712.6-3739      258.121  -37.597 4.8  348.963   +0.968    3.4  0.64   5.2    0.0  0.00   0.0
IGR J17586-2129       269.597  -21.314 4.1    8.030   +1.402    2.8  0.45   6.1    0.0  0.00   0.0
IGR J17252-3616       261.338  -36.223 6.2  351.565   -0.348    1.8  0.47   3.9    0.0  0.00   0.0
IGR J17331-2406       263.298  -24.129 5.4    2.601   +4.907    1.7  0.38   4.5    0.0  0.00   0.0
IGR J17488-3253       267.194  -32.963 0.0  356.904   -2.664    1.5  0.00   4.3    0.0  0.00   0.0
GX 9+1                270.292  -20.486 5.4    9.071   +1.250    2.4  0.54   4.5    0.0  0.00   0.0
NEW SOURCE            267.728  -34.646 3.8  355.683   -3.905    2.4  0.37   6.7    0.0  0.00   0.0
NEW SOURCE            260.762  -32.461 5.3  354.407   +2.163    1.8  0.39   4.7    0.0  0.00   0.0
JEM-X
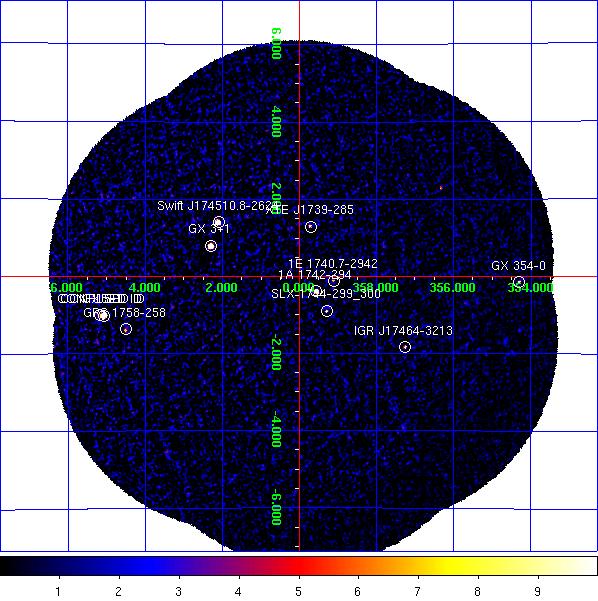
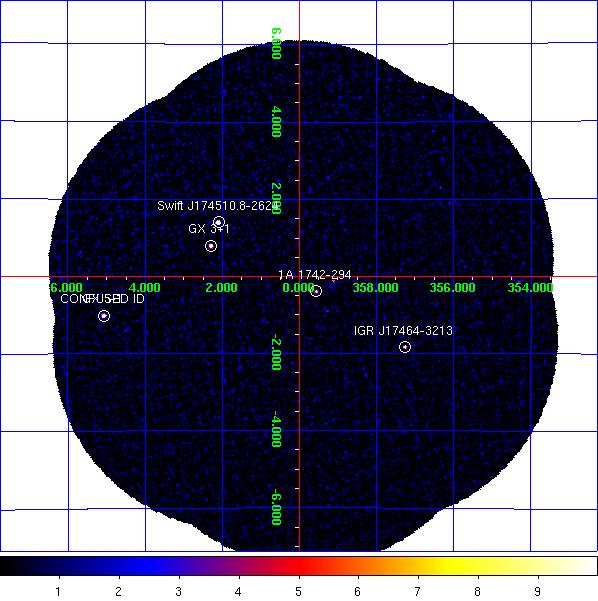
JEM-X1+2 combined significance mosaic images. Left: 3-10 keV. Right: 10-25 keV.
Sources labelled were detected in the 3-10 keV image > 6σ. The sources detected above 3σ in the 3-10 keV and/or 10-25 keV band are listed in the table below. Fluxes are extracted at the known catalogue position of the source (i.e. no fitting of the source position is done), with
mosaic_spec, in two bands: A = 3-10 keV (1 Crab ~ 97 cps [J1], 103 cps [J2]); B = 10-25 keV (1 Crab ~ 29 cps [J1], 27 cps [J2]). NOTES: The object marked as SLX 1744-299_300 is used to indicate two low-mass x-ray binaries separated by 2.7 arcminutes, SLX 1744-299 and SLX 1744-300; the position for SLX 1744-299 is used, although it can not be ruled out that SLX 1744-300 may dominate the emission some of the time. The systematic noise increases towards the edge of the field of view and in the vicinity of very bright sources, such as GX 5-1;
NEW SOURCEs < 6σ towards the border of the image and/or near GX 5-1 may, therefore, be spurious.
JEM-X1+2 Detected Sources in 3-10 keV (A) and 10-25 keV (B).
Source Name             RA       dec      l        b     A(cps)  +/-   sig  B(cps)  +/-   sig
==================== ========  ======= ======== ======== ====== ===== ===== ====== ===== =====
1A 1742-294           266.523  -29.515  359.559   -0.389    9.4  0.25  38.2    1.3  0.12  10.1
1E 1740.7-2942        265.978  -29.745  359.116   -0.106    1.7  0.25   6.8    0.7  0.13   5.6
4U 1722-30            261.888  -30.802  356.320   +2.298    3.2  0.58   5.6    0.9  0.36   2.7
GRS 1758-258          270.303  -25.741    4.511   -1.361    6.3  0.85   7.4    0.9  0.41   2.1
GX 3+1                266.985  -26.557    2.300   +0.795   57.4  0.47 122.4    5.5  0.21  25.8
GX 354-0              262.989  -33.835  354.302   -0.150    8.4  0.96   8.7    2.8  0.67   4.2
GX 5-1                270.283  -25.073    5.082   -1.015  116.5  1.35  86.2   15.7  0.63  24.9
IGR J17464-3213       266.567  -32.229  357.260   -1.832    2.7  0.30   9.0    1.8  0.17  10.4
SLX 1744-299_300      266.858  -29.999  359.297   -0.889    1.7  0.23   7.3    0.3  0.12   2.8
Swift J174510.8-2624  266.285  -26.406    2.104   +1.410   55.4  0.52 106.2   12.9  0.25  51.8
XTE J1739-285         264.975  -28.496  359.714   +1.298    2.7  0.30   9.2    0.2  0.15   1.3
CONFUSED ID           270.289  -25.079    5.080   -1.022  117.9  1.34  87.8   15.9  0.63  25.3
CONFUSED ID           270.320  -24.996    5.166   -1.006   27.9  1.26  22.2    3.2  0.63   5.1
NEW SOURCE            271.028  -25.264    5.248   -1.695    7.0  1.35   5.2    0.7  0.67   1.1
NEW SOURCE            269.082  -26.509    3.298   -0.794    2.1  0.48   4.5    0.0  0.00   0.0