INTEGRAL Galactic bulge Monitoring
Revolution 1219: Observation start 2012-10-06T16:14 = MJD 56206.677
Total Observation GTI = 15564 seconds
IBIS/ISGRI
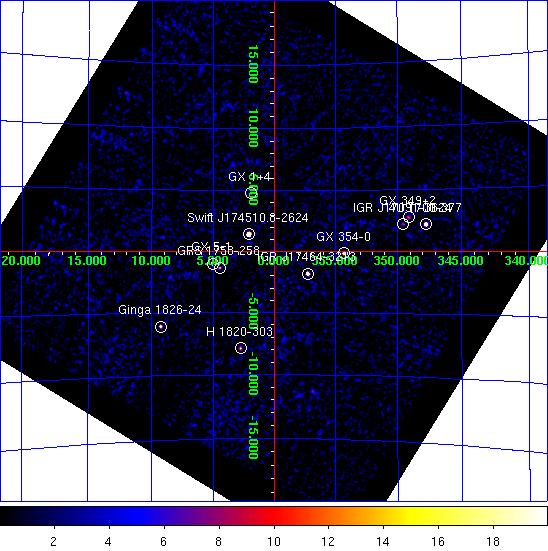

IBIS/ISGRI significance mosaic images. Left: IBIS/ISGRI 18-40 keV. Right: 40-100 keV
Sources detected > 10σ in each band are marked on the image. The table below lists the fitted position, and statistical positional uncertainty in arcmin returned by the mosaic step of
OSA10.1, of all the sources detected in the 18 - 40 keV range (band A: 1 Crab ~ 208 cps ) and 40 - 100 keV range (band B: 1 Crab ~ 100 cps ) where available.NOTES: The table is constructed from the
isgri_mosa_res.fits file - fluxes in the mosaic output are known to be systematically ~10% lower than in the ScW light-curves (see known issues). The systematic noise increases towards the edge of the field of view and NEW SOURCEs < 6σ towards the border of the image may be spurious. IBIS/ISGRI Detected Sources 18-40 keV (A) and 40-100 keV (B)
Source Name             RA       dec   +/-    l        b     A(cps)  +/-   sig  B(cps)  +/-   sig
==================== ========  ======= === ======== ======== ====== ===== ===== ====== ===== =====
Swift J174510.8-2624  266.295  -26.407 0.3    2.108   +1.402   72.5  0.34 212.5   28.1  0.25 114.3
IGR J17464-3213       266.568  -32.239 0.6  357.252   -1.838   25.0  0.36  69.4   16.5  0.25  65.0
4U 1700-377           255.980  -37.854 0.6  347.743   +2.171   56.4  0.94  60.2   18.2  0.60  30.6
GX 5-1                270.271  -25.082 0.9    5.069   -1.009   13.0  0.37  35.2    1.5  0.25   5.9
GX 354-0              263.003  -33.841 1.1  354.304   -0.163   10.8  0.39  27.9    2.9  0.27  10.7
Ginga 1826-24         277.363  -23.799 1.3    9.268   -6.085   14.2  0.60  23.5    6.5  0.40  16.4
H 1820-303            275.911  -30.359 1.6    2.787   -7.907    9.3  0.53  17.7    0.0  0.00   0.0
GX 1+4                263.033  -24.756 1.7    1.941   +4.771    6.1  0.36  17.0    0.0  0.00   0.0
GRS 1758-258          270.284  -25.748 1.8    4.496   -1.349    6.1  0.39  15.9    5.0  0.27  18.6
GX 349+2              256.427  -36.418 2.0  349.104   +2.757   10.1  0.75  13.4    0.0  0.00   0.0
IGR J17091-3624       257.304  -36.413 2.4  349.530   +2.195    7.7  0.68  11.2    5.1  0.45  11.2
3A 1822-371           276.482  -37.159 3.3  356.814  -11.341    6.4  0.82   7.8    0.0  0.00   0.0
GX 9+1                270.430  -20.470 3.7    9.149   +1.146    3.1  0.46   6.9    0.0  0.00   0.0
SLX 1735-269          264.636  -26.983 3.9    0.837   +2.357    2.2  0.34   6.4    1.0  0.24   4.2
IGR J17544-2619       268.672  -26.295 4.6    3.297   -0.369    1.9  0.36   5.4    0.0  0.00   0.0
GX 17+2               274.005  -14.012 4.3   16.453   +1.290   13.5  2.31   5.8    0.0  0.00   0.0
2E 1829.0-2913        277.985  -29.106 5.0    4.733   -8.959    3.2  0.00   5.0    0.0  0.00   0.0
SLX 1746-331          267.340  -33.225 6.7  356.741   -2.903    1.4  0.39   3.6    0.0  0.00   0.0
JEM-X
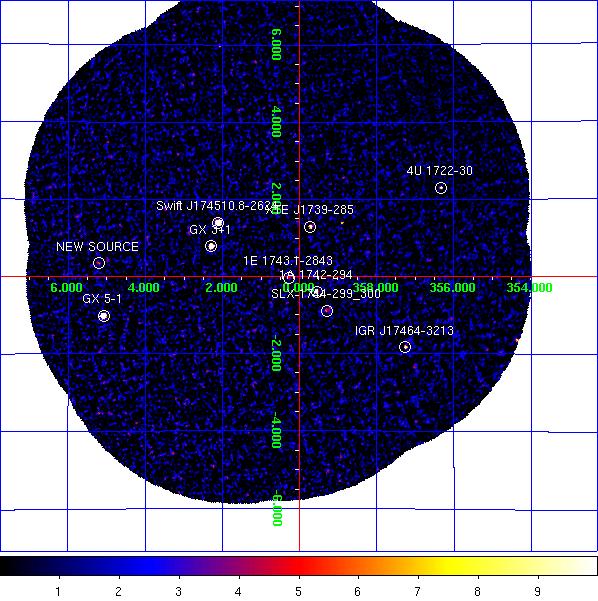
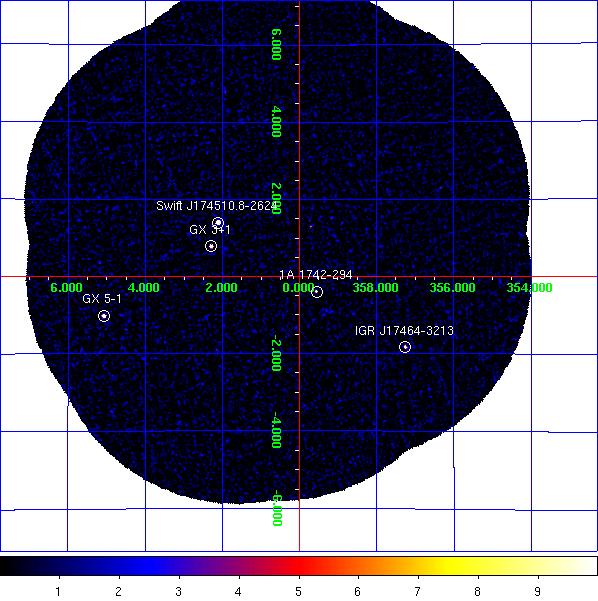
JEM-X1+2 combined significance mosaic images. Left: 3-10 keV. Right: 10-25 keV.
Sources labelled were detected in the 3-10 keV image > 6σ. The sources detected above 3σ in the 3-10 keV and/or 10-25 keV band are listed in the table below. Fluxes are extracted at the known catalogue position of the source (i.e. no fitting of the source position is done), with
mosaic_spec, in two bands: A = 3-10 keV (1 Crab ~ 97 cps [J1], 103 cps [J2]); B = 10-25 keV (1 Crab ~ 29 cps [J1], 27 cps [J2]). NOTES: The object marked as SLX 1744-299_300 is used to indicate two low-mass x-ray binaries separated by 2.7 arcminutes, SLX 1744-299 and SLX 1744-300; the position for SLX 1744-299 is used, although it can not be ruled out that SLX 1744-300 may dominate the emission some of the time. The systematic noise increases towards the edge of the field of view and in the vicinity of very bright sources, such as GX 5-1;
NEW SOURCEs < 6σ towards the border of the image and/or near GX 5-1 may, therefore, be spurious.
JEM-X1+2 Detected Sources in 3-10 keV (A) and 10-25 keV (B).
Source Name             RA       dec      l        b     A(cps)  +/-   sig  B(cps)  +/-   sig
==================== ========  ======= ======== ======== ====== ===== ===== ====== ===== =====
1A 1742-294           266.520  -29.523  359.552   -0.391    8.9  0.33  27.1    1.3  0.15   8.7
1E 1743.1-2843        266.587  -28.729    0.260   -0.029    2.1  0.32   6.6    0.4  0.15   2.5
4U 1722-30            261.888  -30.802  356.320   +2.298    6.3  0.68   9.3    0.9  0.36   2.5
GRS 1734-292          264.367  -29.142  358.883   +1.404    1.4  0.33   4.2    0.2  0.16   1.6
GX 1+4                263.009  -24.746    1.937   +4.795    2.4  0.74   3.2    1.0  0.38   2.6
GX 3+1                266.989  -26.559    2.301   +0.792   47.0  0.42 111.2    4.2  0.18  22.7
GX 354-0              262.989  -33.835  354.302   -0.150   11.5  2.56   4.5    5.3  1.72   3.1
GX 5-1                270.290  -25.078    5.081   -1.022  136.4  1.25 109.1   14.8  0.53  28.0
IGR J17464-3213       266.567  -32.229  357.260   -1.832    6.1  0.58  10.5    4.0  0.32  12.8
SLX 1735-269          264.571  -26.994    0.796   +2.400    1.3  0.36   3.6    0.3  0.17   1.6
SLX 1744-299_300      266.858  -29.999  359.297   -0.889    2.4  0.35   6.9    0.5  0.17   2.8
Swift J174510.8-2624  266.298  -26.403    2.113   +1.402   79.5  0.44 181.8   16.3  0.20  81.6
XTE J1739-285         264.975  -28.496  359.714   +1.298    5.5  0.33  16.8    0.6  0.15   4.0
NEW SOURCE            269.053  -24.282    5.209   +0.349    6.6  1.05   6.3    1.1  0.48   2.4
NEW SOURCE            265.079  -32.867  356.058   -1.099    4.0  0.74   5.4    0.5  0.42   1.3
NEW SOURCE            269.028  -24.299    5.183   +0.360    5.4  1.04   5.2    1.4  0.48   2.9