INTEGRAL Galactic bulge Monitoring
Revolution 1028: Observation start 2011-03-16T12:45 = MJD 55636.532
Total Observation GTI = 12075 seconds
IBIS/ISGRI
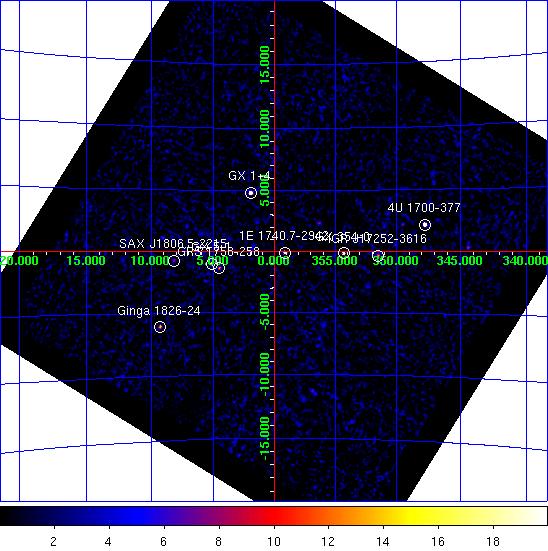
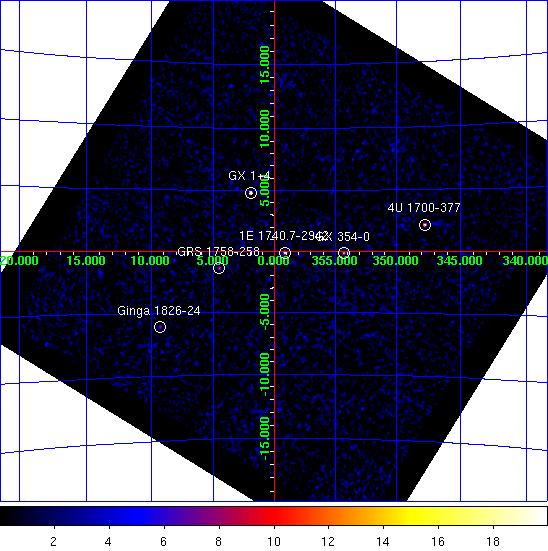
IBIS/ISGRI significance mosaic images. Left: IBIS/ISGRI 18-40 keV. Right: 40-100 keV
Sources detected > 10σ in each band are marked on the image. The table below lists the fitted position, and statistical positional uncertainty in arcmin returned by the mosaic step of
OSA10.1, of all the sources detected in the 18 - 40 keV range (band A: 1 Crab ~ 208 cps ) and 40 - 100 keV range (band B: 1 Crab ~ 100 cps ) where available.NOTES: The table is constructed from the
isgri_mosa_res.fits file - fluxes in the mosaic output are known to be systematically ~10% lower than in the ScW light-curves (see known issues). The systematic noise increases towards the edge of the field of view and NEW SOURCEs < 6σ towards the border of the image may be spurious. IBIS/ISGRI Detected Sources 18-40 keV (A) and 40-100 keV (B)
Source Name             RA       dec   +/-    l        b     A(cps)  +/-   sig  B(cps)  +/-   sig
==================== ========  ======= === ======== ======== ====== ===== ===== ====== ===== =====
GX 1+4                263.007  -24.744 0.6    1.937   +4.797   27.2  0.40  67.7    0.0  0.00   0.0
4U 1700-377           255.986  -37.848 0.6  347.751   +2.172   46.9  0.75  62.1   11.8  0.54  22.0
GX 354-0              262.990  -33.830 0.9  354.306   -0.148   13.8  0.41  33.4    4.9  0.32  15.5
GX 5-1                270.285  -25.071 1.1    5.084   -1.015   12.7  0.44  29.2    0.0  0.00   0.0
1E 1740.7-2942        265.981  -29.733 1.1  359.127   -0.101    9.5  0.33  29.0    5.8  0.26  22.8
Ginga 1826-24         277.372  -23.792 1.6    9.279   -6.089   13.6  0.77  17.6    5.8  0.55  10.4
IGR J17252-3616       261.291  -36.274 2.0  351.501   -0.344    6.2  0.46  13.6    1.7  0.34   4.9
GRS 1758-258          270.309  -25.736 1.8    4.517   -1.363    6.7  0.44  15.3    4.5  0.33  13.8
SAX J1806.5-2215      271.675  -22.249 2.6    8.168   -0.737    5.3  0.52  10.2    2.2  0.39   5.8
4U 1722-30            261.868  -30.798 3.1  356.314   +2.315    3.2  0.38   8.4    1.7  0.29   5.9
OAO 1657-415          255.169  -41.647 2.8  344.360   +0.345   11.2  1.21   9.3    0.0  0.00   0.0
IGR J17091-3624       257.294  -36.420 2.9  349.521   +2.197    5.2  0.58   8.9    0.0  0.00   0.0
3A 1822-371           276.517  -37.164 3.3  356.821  -11.368    5.4  0.68   7.9    0.0  0.00   0.0
GX 9+1                270.430  -20.563 3.5    9.068   +1.100    4.3  0.58   7.3    0.0  0.00   0.0
IGR J17177-3656       259.401  -36.928 4.2  350.100   +0.530    3.3  0.55   6.0    2.5  0.40   6.2
GX 17+2               274.027  -13.938 4.0   16.529   +1.307   46.7  7.37   6.3    0.0  0.00   0.0
AX J1749.2-2725       267.354  -27.315 5.1    1.820   +0.123    1.7  0.00   4.8    0.0  0.00   0.0
Oph Cluster           258.011  -23.291 5.4    0.583   +9.394    2.5  0.55   4.6    0.0  0.00   0.0
1A 1742-294           266.446  -29.543 0.0  359.500   -0.346    1.6  0.00   4.5    0.0  0.00   0.0
GX 349+2              256.461  -36.427 4.9  349.113   +2.730    3.1  0.62   5.0    0.0  0.00   0.0
H 1820-303            276.006  -30.289 0.0    2.888   -7.948    2.2  0.00   4.1    0.0  0.00   0.0
SAX J1712.6-3739      258.024  -37.591 6.8  348.922   +1.033    2.0  0.55   3.5    0.0  0.00   0.0
SLX 1744-299_300      266.735  -30.035 6.5  359.211   -0.816    1.3  0.00   3.7    0.0  0.00   0.0
PKS 1830-211          278.379  -21.003 6.5   12.202   -5.654    3.9  1.05   3.7    0.0  0.00   0.0
GX 3+1                267.013  -26.530 6.2    2.336   +0.789    1.4  0.35   3.9    0.0  0.00   0.0
XTE J1807-294         271.809  -29.323 0.0    2.035   -4.277    1.4  0.00   3.5    0.0  0.00   0.0
IGR J18048-1455       271.194  -14.983 5.9   14.290   +3.207   10.0  2.44   4.1    0.0  0.00   0.0
JEM-X

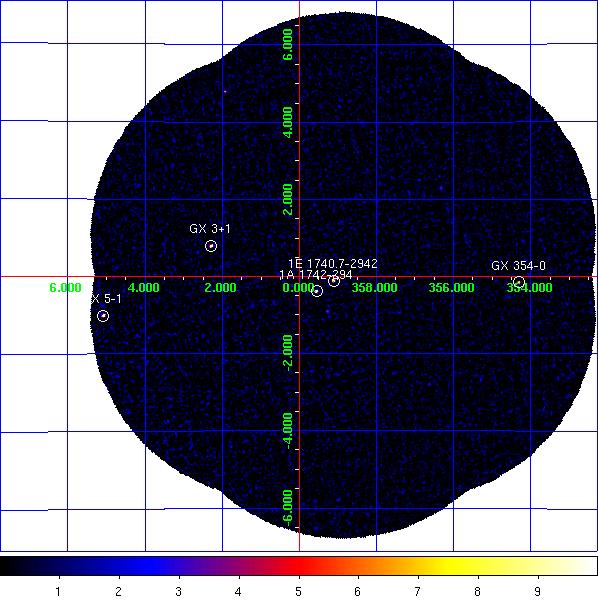
JEM-X1+2 combined significance mosaic images. Left: 3-10 keV. Right: 10-25 keV.
Sources labelled were detected in the 3-10 keV image > 6σ. The sources detected above 3σ in the 3-10 keV and/or 10-25 keV band are listed in the table below. Fluxes are extracted at the known catalogue position of the source (i.e. no fitting of the source position is done), with
mosaic_spec, in two bands: A = 3-10 keV (1 Crab ~ 97 cps [J1], 103 cps [J2]); B = 10-25 keV (1 Crab ~ 29 cps [J1], 27 cps [J2]). NOTES: The object marked as SLX 1744-299_300 is used to indicate two low-mass x-ray binaries separated by 2.7 arcminutes, SLX 1744-299 and SLX 1744-300; the position for SLX 1744-299 is used, although it can not be ruled out that SLX 1744-300 may dominate the emission some of the time. The systematic noise increases towards the edge of the field of view and in the vicinity of very bright sources, such as GX 5-1;
NEW SOURCEs < 6σ towards the border of the image and/or near GX 5-1 may, therefore, be spurious.
JEM-X1+2 Detected Sources in 3-10 keV (A) and 10-25 keV (B).
Source Name             RA       dec      l        b     A(cps)  +/-   sig  B(cps)  +/-   sig
==================== ========  ======= ======== ======== ====== ===== ===== ====== ===== =====
1A 1742-294           266.522  -29.517  359.557   -0.389   10.8  0.23  46.3    1.8  0.14  13.2
1A 1743-288           266.757  -28.868    0.219   -0.228    4.7  0.25  19.2    0.3  0.14   2.1
1E 1740.7-2942        265.981  -29.748  359.114   -0.109    2.2  0.21  10.3    1.5  0.13  11.3
1E 1743.1-2843        266.587  -28.729    0.260   -0.029    0.8  0.24   3.4    0.2  0.14   1.5
4U 1722-30            261.888  -30.802  356.320   +2.298    1.8  0.31   5.8    0.7  0.22   3.2
GX 1+4                263.009  -24.746    1.937   +4.795    1.3  0.97   1.3    3.2  0.71   4.5
GX 3+1                266.982  -26.566    2.291   +0.793   33.4  0.47  71.4    3.3  0.24  13.9
GX 354-0              262.989  -33.835  354.302   -0.150    7.2  0.47  15.4    2.7  0.35   7.6
GX 5-1                270.280  -25.077    5.077   -1.014  143.7  3.45  41.6   23.1  1.84  12.6
SLX 1744-299_300      266.858  -29.999  359.297   -0.889    2.2  0.23   9.4    0.4  0.14   2.7
NEW SOURCE            272.030  -27.507    3.723   -3.571   10.7  2.09   5.1    0.0  0.00   0.0
NEW SOURCE            272.612  -28.504    3.094   -4.501    7.1  1.83   3.9    0.0  0.00   0.0
NEW SOURCE            270.421  -25.673    4.622   -1.420    6.1  1.68   3.6    0.0  0.00   0.0
NEW SOURCE            270.866  -27.107    3.570   -2.473    4.0  1.03   3.9    0.7  0.59   1.2
NEW SOURCE            271.649  -26.091    4.800   -2.588   13.1  2.85   4.6    2.1  1.57   1.4
NEW SOURCE            270.765  -26.924    3.685   -2.305    4.6  1.19   3.9    0.0  0.00   0.0