INTEGRAL Galactic bulge Monitoring
Revolution 0974: Observation start 2010-10-06T10:25 = MJD 55475.435
Total Observation GTI = 10477 seconds
IBIS/ISGRI
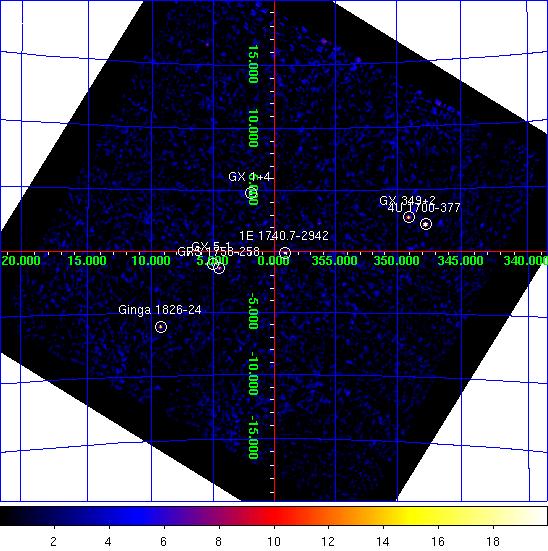

IBIS/ISGRI significance mosaic images. Left: IBIS/ISGRI 18-40 keV. Right: 40-100 keV
Sources detected > 10σ in each band are marked on the image. The table below lists the fitted position, and statistical positional uncertainty in arcmin returned by the mosaic step of
OSA10.1, of all the sources detected in the 18 - 40 keV range (band A: 1 Crab ~ 208 cps ) and 40 - 100 keV range (band B: 1 Crab ~ 100 cps ) where available.NOTES: The table is constructed from the
isgri_mosa_res.fits file - fluxes in the mosaic output are known to be systematically ~10% lower than in the ScW light-curves (see known issues). The systematic noise increases towards the edge of the field of view and NEW SOURCEs < 6σ towards the border of the image may be spurious. IBIS/ISGRI Detected Sources 18-40 keV (A) and 40-100 keV (B)
Source Name             RA       dec   +/-    l        b     A(cps)  +/-   sig  B(cps)  +/-   sig
==================== ========  ======= === ======== ======== ====== ===== ===== ====== ===== =====
GX 1+4                263.012  -24.743 0.7    1.941   +4.794   22.0  0.44  49.9    0.0  0.00   0.0
4U 1700-377           255.988  -37.846 0.9  347.754   +2.172   28.7  0.80  36.0    9.1  0.59  15.5
GX 5-1                270.282  -25.082 0.9    5.074   -1.019   13.8  0.41  33.4    0.0  0.00   0.0
1E 1740.7-2942        265.988  -29.745 1.2  359.121   -0.113    8.9  0.37  23.9    6.1  0.30  20.2
GX 349+2              256.419  -36.425 1.5  349.094   +2.758   13.5  0.68  19.9    0.0  0.00   0.0
Ginga 1826-24         277.381  -23.795 1.6    9.280   -6.098   13.1  0.74  17.8    7.2  0.55  13.1
GRS 1758-258          270.312  -25.729 1.6    4.525   -1.362    7.1  0.39  18.0    4.0  0.31  12.7
MAXI J1659-152        254.737  -15.235 2.7    5.524  +16.555   20.6  2.10   9.8    5.7  1.45   3.9
GX 354-0              262.994  -33.793 2.9  354.339   -0.130    3.9  0.42   9.2    0.0  0.00   0.0
4U 1722-30            261.871  -30.802 2.8  356.311   +2.310    3.5  0.37   9.4    2.1  0.29   7.0
H 1820-303            275.936  -30.361 3.5    2.795   -7.927    4.2  0.58   7.2    0.0  0.00   0.0
SLX 1735-269          264.606  -27.031 3.9    0.781   +2.355    2.4  0.36   6.5    1.3  0.00   4.4
GX 9+1                270.402  -20.544 4.0    9.072   +1.132    3.3  0.51   6.4    0.0  0.00   0.0
SLX 1744-299_300      266.903  -29.952 0.0  359.357   -0.898    1.9  0.00   5.2    0.0  0.00   0.0
3A 1822-371           276.547  -37.118 5.9  356.874  -11.370    3.4  0.82   4.1    0.0  0.00   0.0
V2400 Oph             258.228  -24.261 5.4  359.894   +8.673    2.1  0.47   4.5    0.0  0.00   0.0
IGR J17285-2922       262.180  -29.333 0.0  357.684   +2.901    1.6  0.00   4.1    1.7  0.30   5.7
XTE J1710-281         257.494  -28.076 5.9  356.373   +6.996    2.0  0.49   4.2    0.0  0.00   0.0
IGR J17379-3747       264.564  -37.824 5.5  351.633   -3.379    2.7  0.60   4.4    0.0  0.00   0.0
KS 1741-293           266.141  -29.380 0.0  359.501   -0.036    1.5  0.00   4.0    0.0  0.00   0.0
GX 3+1                266.964  -26.526 4.9    2.316   +0.828    2.0  0.40   5.0    0.0  0.00   0.0
IGR J17354-3255       263.907  -32.897 0.0  355.506   -0.284    1.6  0.00   4.0    0.0  0.00   0.0
IGR J17451-3022       266.299  -30.358 5.7  358.739   -0.663    1.5  0.34   4.3    0.0  0.00   0.0
1A 1742-294           266.490  -29.457 8.4  359.594   -0.335    1.1  0.40   2.8    0.0  0.00   0.0
1RXS J174607.8-21333  266.488  -21.603 5.8    6.308   +3.747    1.8  0.43   4.2    0.0  0.00   0.0
1RXS J165424.7-29541  253.632  -29.969 6.5  352.795   +8.550    2.5  0.00   3.7    0.0  0.00   0.0
IGR J17404-3655       265.185  -36.927 6.3  352.657   -3.322    2.2  0.56   3.9    0.0  0.00   0.0
GRO J1655-40          253.474  -39.739 7.7  345.052   +2.539    4.2  1.35   3.1    0.0  0.00   0.0
MAXI J1807-228        271.966  -22.820 6.3    7.800   -1.250    1.8  0.47   3.8    0.0  0.00   0.0
GX 13+1               273.518  -17.184 6.0   13.442   +0.189    3.4  0.85   4.1    0.0  0.00   0.0
GX 17+2               273.991  -13.945 6.3   16.506   +1.334   10.4  2.69   3.8    0.0  0.00   0.0
Swift J175759.9-2246  269.575  -22.691 7.1    6.826   +0.732    1.5  0.00   3.4    0.0  0.00   0.0
IGR J17252-3616       261.420  -36.249 0.0  351.581   -0.417    1.8  0.00   3.3    0.0  0.00   0.0
NEW SOURCE            255.517  -36.413 3.7  348.663   +3.342    4.8  0.69   6.9    0.0  0.00   0.0
NEW SOURCE            268.881  -26.830 4.2    2.930   -0.800    2.4  0.39   6.0    0.0  0.00   0.0
NEW SOURCE            275.025  -39.673 4.4  353.998  -11.404    6.0  1.03   5.7    0.0  0.00   0.0
NEW SOURCE            268.430  -37.358 4.3  353.619   -5.763    3.4  0.58   5.8    0.0  0.00   0.0
JEM-X
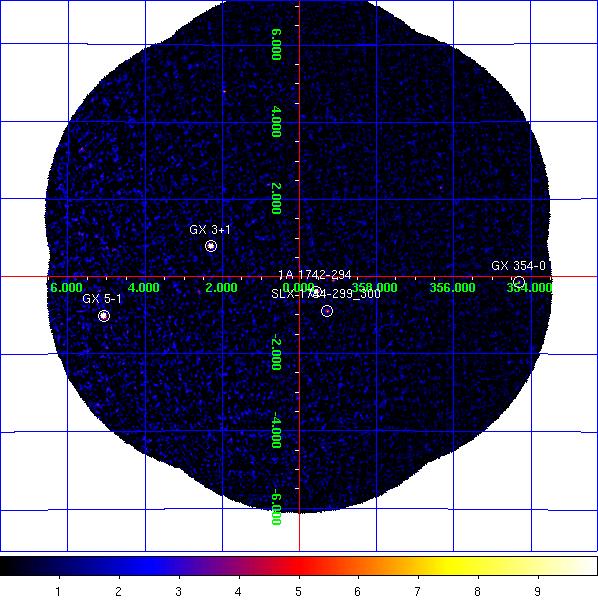
JEM-X2 significance mosaic images. Left: 3-10 keV. Right: 10-25 keV.
Sources labelled were detected in the 3-10 keV image > 6σ. The sources detected above 3σ in the 3-10 keV and/or 10-25 keV band are listed in the table below. Fluxes are extracted at the known catalogue position of the source (i.e. no fitting of the source position is done), with
mosaic_spec, in two bands: A = 3-10 keV (1 Crab ~ 97 cps [J1], 103 cps [J2]); B = 10-25 keV (1 Crab ~ 29 cps [J1], 27 cps [J2]). NOTES: The object marked as SLX 1744-299_300 is used to indicate two low-mass x-ray binaries separated by 2.7 arcminutes, SLX 1744-299 and SLX 1744-300; the position for SLX 1744-299 is used, although it can not be ruled out that SLX 1744-300 may dominate the emission some of the time. The systematic noise increases towards the edge of the field of view and in the vicinity of very bright sources, such as GX 5-1;
NEW SOURCEs < 6σ towards the border of the image and/or near GX 5-1 may, therefore, be spurious.
JEM-X2 Detected Sources in 3-10 keV (A) and 10-25 keV (B).
Source Name             RA       dec      l        b     A(cps)  +/-   sig  B(cps)  +/-   sig
==================== ========  ======= ======== ======== ====== ===== ===== ====== ===== =====
1A 1742-294           266.539  -29.510  359.571   -0.398    8.0  0.29  27.8    1.3  0.16   8.3
1E 1740.7-2942        265.978  -29.745  359.116   -0.106    1.4  0.26   5.3    1.2  0.16   7.4
1E 1743.1-2843        266.587  -28.729    0.260   -0.029    1.0  0.28   3.5    0.0  0.00   0.0
4U 1722-30            261.888  -30.802  356.320   +2.298    1.6  0.44   3.7    0.7  0.30   2.4
GX 1+4                263.009  -24.746    1.937   +4.795    3.1  0.64   4.9    2.5  0.43   5.8
GX 3+1                266.987  -26.566    2.294   +0.790   23.5  0.40  58.6    2.3  0.21  10.9
GX 354-0              262.989  -33.835  354.302   -0.150    6.8  1.05   6.5    0.8  0.77   1.0
GX 5-1                270.282  -25.079    5.076   -1.016  121.6  1.97  61.7   17.8  0.96  18.6
SLX 1735-269          264.571  -26.994    0.796   +2.400    1.1  0.28   3.9    0.4  0.17   2.2
SLX 1744-299_300      266.858  -29.999  359.297   -0.889    1.9  0.29   6.7    0.3  0.17   1.7
NEW SOURCE            266.534  -22.413    5.636   +3.291   11.8  2.14   5.5    2.1  1.63   1.3
NEW SOURCE            268.311  -26.903    2.610   -0.399    1.9  0.41   4.5    0.6  0.23   2.6
NEW SOURCE            272.597  -26.063    5.236   -3.319   17.3  3.65   4.7    0.0  0.00   0.0
NEW SOURCE            268.307  -26.899    2.611   -0.393    1.8  0.41   4.4    0.6  0.23   2.5