INTEGRAL Galactic bulge Monitoring
Revolution 0966: Observation start 2010-09-10T21:56 = MJD 55449.914
Total Observation GTI = 11863 seconds
IBIS/ISGRI
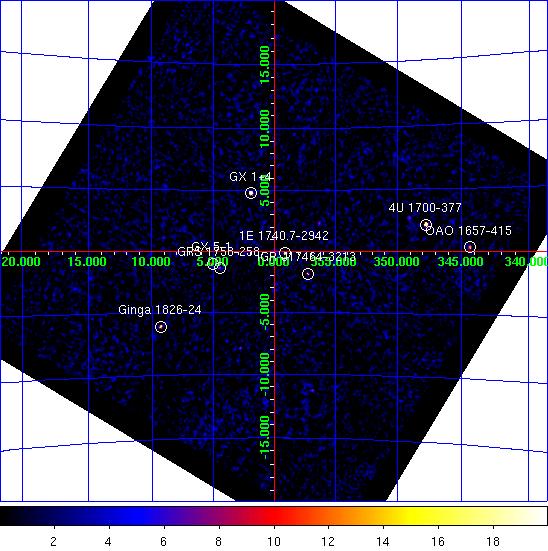
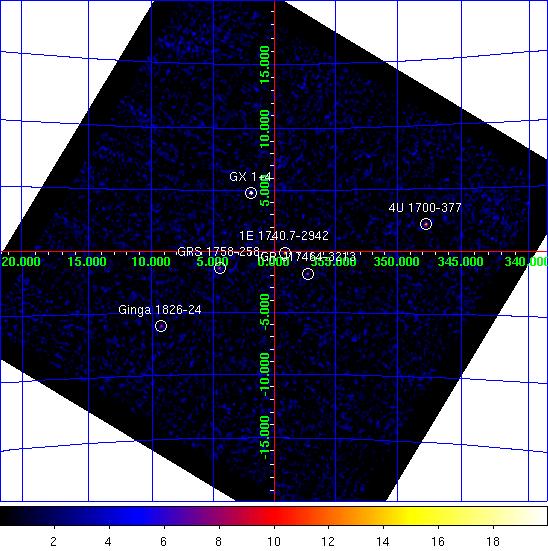
IBIS/ISGRI significance mosaic images. Left: IBIS/ISGRI 18-40 keV. Right: 40-100 keV
Sources detected > 10σ in each band are marked on the image. The table below lists the fitted position, and statistical positional uncertainty in arcmin returned by the mosaic step of
OSA10.1, of all the sources detected in the 18 - 40 keV range (band A: 1 Crab ~ 208 cps ) and 40 - 100 keV range (band B: 1 Crab ~ 100 cps ) where available.NOTES: The table is constructed from the
isgri_mosa_res.fits file - fluxes in the mosaic output are known to be systematically ~10% lower than in the ScW light-curves (see known issues). The systematic noise increases towards the edge of the field of view and NEW SOURCEs < 6σ towards the border of the image may be spurious. IBIS/ISGRI Detected Sources 18-40 keV (A) and 40-100 keV (B)
Source Name             RA       dec   +/-    l        b     A(cps)  +/-   sig  B(cps)  +/-   sig
==================== ========  ======= === ======== ======== ====== ===== ===== ====== ===== =====
GX 1+4                263.004  -24.752 0.6    1.929   +4.795   25.7  0.44  58.7    0.0  0.00   0.0
4U 1700-377           255.987  -37.862 0.9  347.741   +2.162   32.1  0.84  38.4    9.1  0.63  14.4
1E 1740.7-2942        265.980  -29.751 1.0  359.112   -0.110   10.3  0.34  30.0    5.9  0.29  20.4
GX 5-1                270.297  -25.070 1.1    5.091   -1.024   10.9  0.39  27.6    0.0  0.00   0.0
Ginga 1826-24         277.379  -23.794 1.4    9.280   -6.096   13.2  0.65  20.1    5.6  0.50  11.3
IGR J17464-3213       266.568  -32.235 1.6  357.255   -1.836    6.9  0.40  17.2    3.9  0.32  12.3
OAO 1657-415          255.191  -41.654 1.8  344.365   +0.328   32.0  2.10  15.2    0.0  0.00   0.0
GRS 1758-258          270.300  -25.742 2.5    4.508   -1.359    4.1  0.38  10.7    3.4  0.31  11.2
4U 1722-30            261.882  -30.813 2.7  356.308   +2.297    3.9  0.40   9.7    0.0  0.00   0.0
H 1820-303            275.919  -30.347 2.7    2.801   -7.907    5.4  0.55   9.8    0.0  0.00   0.0
GX 349+2              256.450  -36.489 2.8  349.058   +2.700    7.0  0.76   9.3    0.0  0.00   0.0
3A 1822-371           276.456  -37.080 3.1  356.878  -11.288    6.1  0.73   8.4    0.0  0.00   0.0
Swift J174535.5-2901  266.313  -29.001 4.3  359.902   +0.035    1.9  0.34   5.8    0.0  0.00   0.0
GX 9+1                270.404  -20.579 3.9    9.042   +1.113    3.2  0.49   6.5    0.0  0.00   0.0
GX 17+2               273.974  -13.996 4.1   16.453   +1.324   15.6  2.51   6.2    0.0  0.00   0.0
SLX 1735-269          264.629  -26.958 4.9    0.854   +2.376    1.9  0.36   5.1    0.0  0.00   0.0
1A 1742-294           266.587  -29.508 4.7  359.594   -0.433    1.8  0.34   5.3    0.0  0.00   0.0
IGR J16500-3307       252.371  -33.132 4.9  349.626   +7.406    5.1  0.00   5.1    0.0  0.00   0.0
V1223 Sgr             283.671  -31.146 5.2    4.943  -14.279    7.8  1.66   4.7    0.0  0.00   0.0
1RXS J175721.2-30440  269.452  -30.711 0.0  359.821   -3.179    1.6  0.00   4.5    0.0  0.00   0.0
GX 3+1                267.062  -26.538 0.0    2.352   +0.747    1.5  0.00   4.3    0.0  0.00   0.0
GX 354-0              263.066  -33.766 5.6  354.395   -0.166    1.9  0.42   4.4    0.0  0.00   0.0
V2400 Oph             258.149  -24.139 5.6  359.953   +8.803    2.3  0.52   4.4    0.0  0.00   0.0
H1825-331             276.999  -33.203 6.2    0.626  -10.001    2.2  0.00   3.9    0.0  0.00   0.0
JEM-X
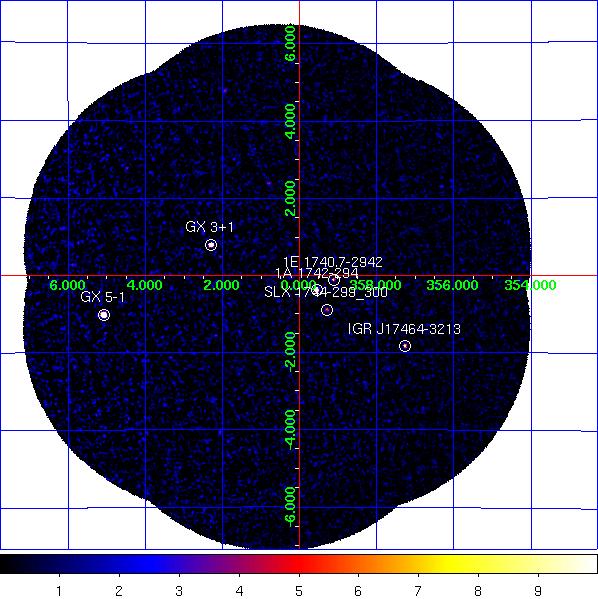
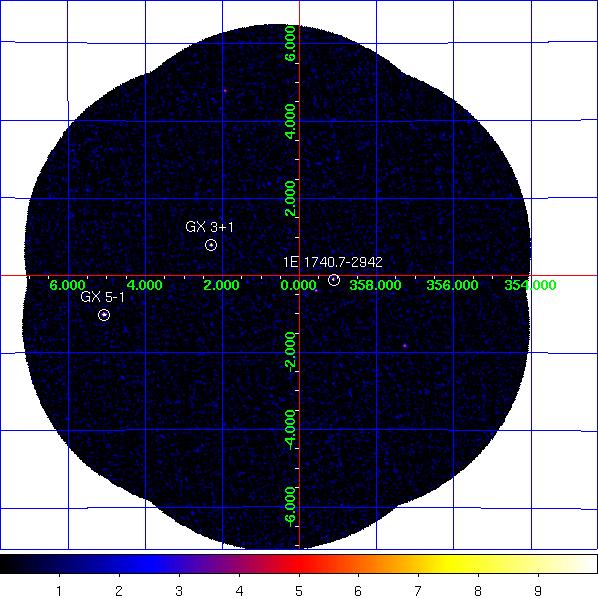
JEM-X1+2 combined significance mosaic images. Left: 3-10 keV. Right: 10-25 keV.
Sources labelled were detected in the 3-10 keV image > 6σ. The sources detected above 3σ in the 3-10 keV and/or 10-25 keV band are listed in the table below. Fluxes are extracted at the known catalogue position of the source (i.e. no fitting of the source position is done), with
mosaic_spec, in two bands: A = 3-10 keV (1 Crab ~ 97 cps [J1], 103 cps [J2]); B = 10-25 keV (1 Crab ~ 29 cps [J1], 27 cps [J2]). NOTES: The object marked as SLX 1744-299_300 is used to indicate two low-mass x-ray binaries separated by 2.7 arcminutes, SLX 1744-299 and SLX 1744-300; the position for SLX 1744-299 is used, although it can not be ruled out that SLX 1744-300 may dominate the emission some of the time. The systematic noise increases towards the edge of the field of view and in the vicinity of very bright sources, such as GX 5-1;
NEW SOURCEs < 6σ towards the border of the image and/or near GX 5-1 may, therefore, be spurious.
JEM-X1+2 Detected Sources in 3-10 keV (A) and 10-25 keV (B).
Source Name             RA       dec      l        b     A(cps)  +/-   sig  B(cps)  +/-   sig
==================== ========  ======= ======== ======== ====== ===== ===== ====== ===== =====