INTEGRAL Galactic bulge Monitoring
Revolution 0961: Observation start 2010-08-26T23:09 = MJD 55434.965
Total Observation GTI = 12388 seconds
IBIS/ISGRI
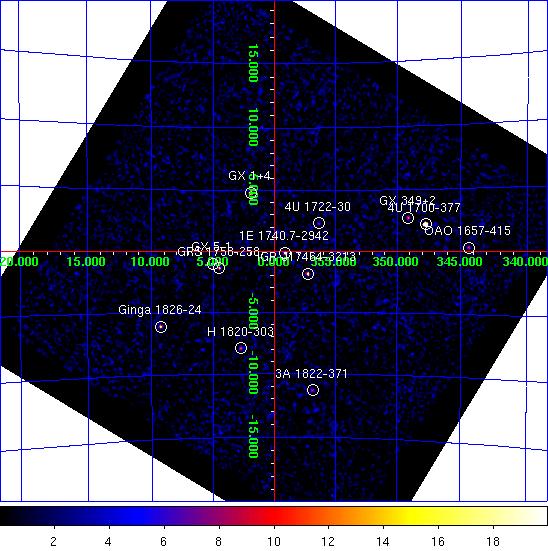
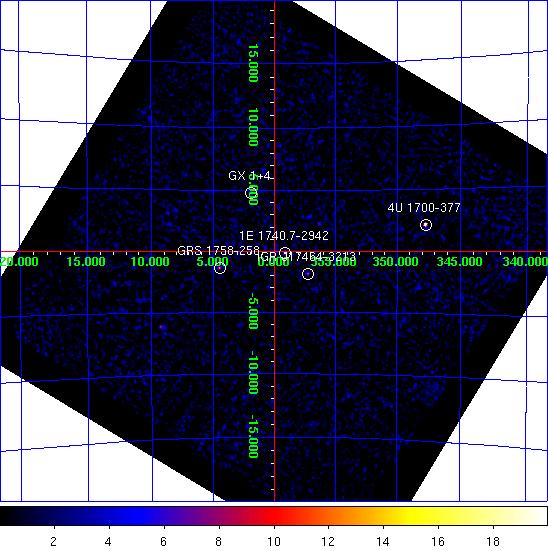
IBIS/ISGRI significance mosaic images. Left: IBIS/ISGRI 18-40 keV. Right: 40-100 keV
Sources detected > 10σ in each band are marked on the image. The table below lists the fitted position, and statistical positional uncertainty in arcmin returned by the mosaic step of
OSA10.1, of all the sources detected in the 18 - 40 keV range (band A: 1 Crab ~ 208 cps ) and 40 - 100 keV range (band B: 1 Crab ~ 100 cps ) where available.NOTES: The table is constructed from the
isgri_mosa_res.fits file - fluxes in the mosaic output are known to be systematically ~10% lower than in the ScW light-curves (see known issues). The systematic noise increases towards the edge of the field of view and NEW SOURCEs < 6σ towards the border of the image may be spurious. IBIS/ISGRI Detected Sources 18-40 keV (A) and 40-100 keV (B)
Source Name             RA       dec   +/-    l        b     A(cps)  +/-   sig  B(cps)  +/-   sig
==================== ========  ======= === ======== ======== ====== ===== ===== ====== ===== =====
4U 1700-377           255.981  -37.849 0.6  347.748   +2.174   47.9  0.73  66.0   15.1  0.54  27.8
GX 1+4                263.010  -24.742 1.0    1.940   +4.796   14.0  0.44  32.0    0.0  0.00   0.0
1E 1740.7-2942        265.988  -29.752 1.1  359.115   -0.116   10.8  0.37  29.3    7.5  0.30  25.4
GX 5-1                270.281  -25.086 1.3    5.070   -1.019    9.1  0.38  23.7    1.3  0.00   4.2
IGR J17464-3213       266.567  -32.237 1.2  357.253   -1.837    8.7  0.35  25.0    3.4  0.29  12.0
Ginga 1826-24         277.370  -23.784 1.6    9.285   -6.083   11.1  0.64  17.4    4.3  0.47   9.2
GRS 1758-258          270.302  -25.735 1.7    4.515   -1.358    5.9  0.36  16.6    3.1  0.29  10.9
GX 349+2              256.462  -36.431 2.0  349.110   +2.726   10.5  0.75  13.9    0.0  0.00   0.0
H 1820-303            275.913  -30.397 2.4    2.753   -7.926    5.7  0.50  11.4    0.0  0.00   0.0
OAO 1657-415          255.209  -41.664 2.2  344.365   +0.312   18.3  1.47  12.5    0.0  0.00   0.0
3A 1822-371           276.458  -37.101 2.5  356.858  -11.298    6.6  0.63  10.5    0.0  0.00   0.0
4U 1722-30            261.901  -30.788 2.5  356.338   +2.297    4.2  0.40  10.5    2.6  0.31   8.3
GX 354-0              263.025  -33.777 3.6  354.367   -0.144    3.0  0.43   7.1    0.0  0.00   0.0
SLX 1735-269          264.604  -26.991 3.5    0.814   +2.377    2.7  0.37   7.4    1.2  0.00   4.1
H 1705-440            257.381  -44.103 5.3  343.386   -2.432    8.4  1.82   4.6    0.0  0.00   0.0
IGR J17252-3616       261.219  -36.302 4.4  351.446   -0.312    2.8  0.49   5.7    1.6  0.38   4.3
1A 1742-294           266.547  -29.538 0.0  359.551   -0.419    1.9  0.00   5.4    0.0  0.00   0.0
GX 9+1                270.375  -20.542 4.2    9.061   +1.155    3.5  0.59   6.0    0.0  0.00   0.0
4U 1735-444           264.670  -44.473 5.3  346.007   -6.962    7.9  1.70   4.7    0.0  0.00   0.0
IGR J17285-2922       262.115  -29.361 5.1  357.630   +2.933    2.0  0.42   4.9    1.3  0.00   4.0
GX 3+1                266.974  -26.622 5.3    2.239   +0.770    1.7  0.36   4.7    0.0  0.00   0.0
Swift J174535.5-2901  266.360  -29.126 0.0  359.818   -0.065    1.6  0.00   4.2    0.0  0.00   0.0
IGR J18249-3243       276.253  -32.740 5.9    0.767   -9.235    1.9  0.00   4.1    0.0  0.00   0.0
IGR J16500-3307       252.618  -33.186 5.7  349.715   +7.212    4.1  0.95   4.3    0.0  0.00   0.0
IGR J18173-2509       274.457  -25.200 6.2    6.795   -4.386    1.8  0.46   3.9    0.0  0.00   0.0
XB 1832-330           278.994  -33.002 5.9    1.543  -11.423    2.6  0.61   4.2    1.9  0.00   4.1
XTE J1752-223         267.995  -22.260 6.4    6.462   +2.210    1.7  0.00   3.8    0.0  0.00   0.0
JEM-X
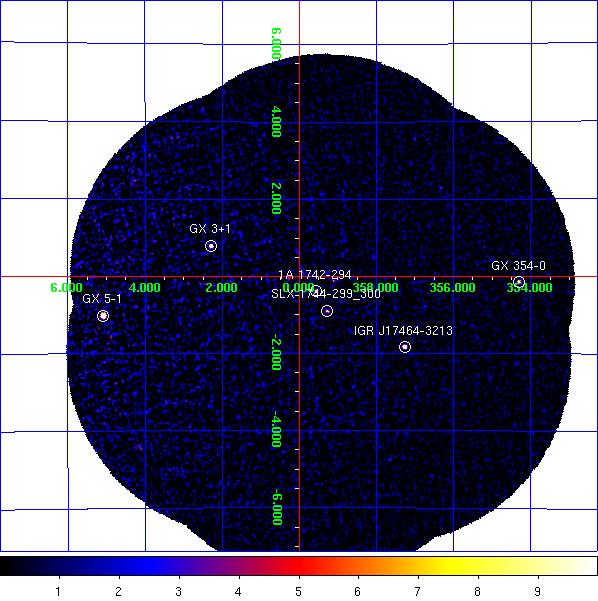
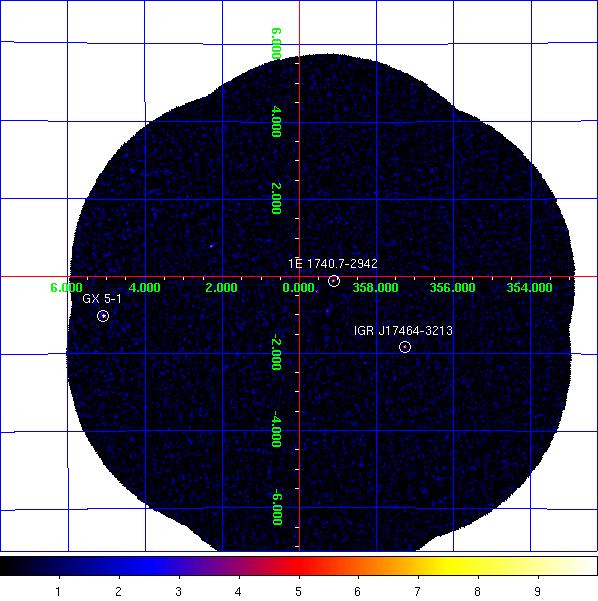
JEM-X2 significance mosaic images. Left: 3-10 keV. Right: 10-25 keV.
Sources labelled were detected in the 3-10 keV image > 6σ. The sources detected above 3σ in the 3-10 keV and/or 10-25 keV band are listed in the table below. Fluxes are extracted at the known catalogue position of the source (i.e. no fitting of the source position is done), with
mosaic_spec, in two bands: A = 3-10 keV (1 Crab ~ 97 cps [J1], 103 cps [J2]); B = 10-25 keV (1 Crab ~ 29 cps [J1], 27 cps [J2]). NOTES: The object marked as SLX 1744-299_300 is used to indicate two low-mass x-ray binaries separated by 2.7 arcminutes, SLX 1744-299 and SLX 1744-300; the position for SLX 1744-299 is used, although it can not be ruled out that SLX 1744-300 may dominate the emission some of the time. The systematic noise increases towards the edge of the field of view and in the vicinity of very bright sources, such as GX 5-1;
NEW SOURCEs < 6σ towards the border of the image and/or near GX 5-1 may, therefore, be spurious.
JEM-X2 Detected Sources in 3-10 keV (A) and 10-25 keV (B).
Source Name             RA       dec      l        b     A(cps)  +/-   sig  B(cps)  +/-   sig
==================== ========  ======= ======== ======== ====== ===== ===== ====== ===== =====
1A 1742-294           266.523  -29.515  359.559   -0.389    2.4  0.26   9.1    0.7  0.16   4.7
1E 1740.7-2942        265.978  -29.745  359.116   -0.106    1.5  0.28   5.3    1.2  0.17   6.9
1E 1743.1-2843        266.587  -28.729    0.260   -0.029    1.7  0.29   5.9    0.3  0.17   1.9
4U 1722-30            261.888  -30.802  356.320   +2.298    2.2  0.56   3.9    0.0  0.00   0.0
GRS 1741.9-2853       266.260  -28.914  359.953   +0.120    1.0  0.29   3.4    0.3  0.17   1.7
GX 3+1                266.983  -26.564    2.294   +0.794   16.6  0.53  31.6    1.5  0.28   5.2
GX 354-0              262.989  -33.830  354.306   -0.147   15.7  0.88  17.9    2.5  0.54   4.6
GX 5-1                270.287  -25.072    5.085   -1.017  117.6  2.14  55.1   14.4  1.12  12.9
IGR J17464-3213       266.567  -32.229  357.260   -1.832    8.8  0.30  29.2    1.3  0.18   7.1
SLX 1744-299_300      266.858  -29.999  359.297   -0.889    2.4  0.27   8.9    0.5  0.16   3.3
NEW SOURCE            266.524  -24.003    4.270   +2.475    9.7  2.16   4.5    0.0  0.00   0.0
NEW SOURCE            266.628  -25.552    2.994   +1.591    2.8  0.73   3.8    0.8  0.40   2.1
NEW SOURCE            270.696  -25.515    4.882   -1.557    6.7  1.56   4.3    1.3  0.87   1.5
NEW SOURCE            273.098  -27.521    4.167   -4.409    7.4  1.54   4.8    0.0  0.00   0.0
NEW SOURCE            267.058  -24.906    3.749   +1.592    3.1  1.01   3.1    1.5  0.57   2.6