INTEGRAL Galactic bulge Monitoring
Revolution 0847: Observation start 2009-09-19T21:52 = MJD 55093.912
Total Observation GTI = 11516 seconds
IBIS/ISGRI

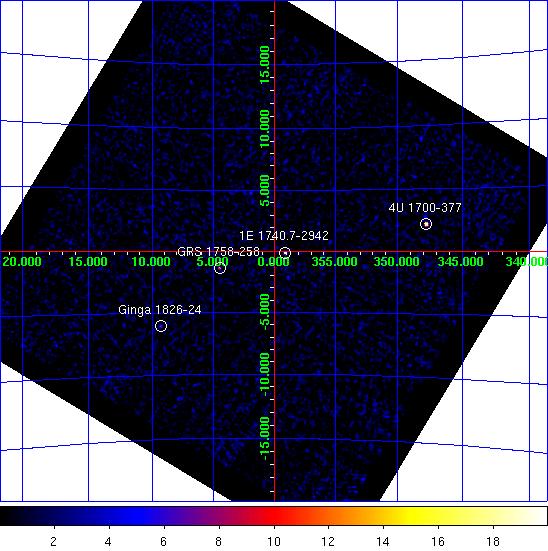
IBIS/ISGRI significance mosaic images. Left: IBIS/ISGRI 18-40 keV. Right: 40-100 keV
Sources detected > 10σ in each band are marked on the image. The table below lists the fitted position, and statistical positional uncertainty in arcmin returned by the mosaic step of
OSA10.1, of all the sources detected in the 18 - 40 keV range (band A: 1 Crab ~ 208 cps ) and 40 - 100 keV range (band B: 1 Crab ~ 100 cps ) where available.NOTES: The table is constructed from the
isgri_mosa_res.fits file - fluxes in the mosaic output are known to be systematically ~10% lower than in the ScW light-curves (see known issues). The systematic noise increases towards the edge of the field of view and NEW SOURCEs < 6σ towards the border of the image may be spurious. IBIS/ISGRI Detected Sources 18-40 keV (A) and 40-100 keV (B)
Source Name             RA       dec   +/-    l        b     A(cps)  +/-   sig  B(cps)  +/-   sig
==================== ========  ======= === ======== ======== ====== ===== ===== ====== ===== =====
4U 1700-377           255.981  -37.846 0.5  347.750   +2.176   86.5  0.94  91.6   23.6  0.71  33.4
GX 5-1                270.283  -25.077 0.9    5.079   -1.016   14.6  0.43  33.7    0.0  0.00   0.0
1E 1740.7-2942        265.981  -29.742 1.1  359.119   -0.106   11.6  0.40  29.0    7.7  0.33  23.2
Ginga 1826-24         277.368  -23.779 1.3    9.288   -6.080   14.1  0.63  22.4    5.0  0.49  10.2
GRS 1758-258          270.294  -25.743 1.3    4.505   -1.355    9.6  0.44  21.8    5.3  0.36  14.8
GX 349+2              256.441  -36.420 1.6  349.109   +2.747   14.3  0.83  17.3    0.0  0.00   0.0
IGR J17511-3057       267.788  -30.965 2.0  358.880   -2.073    5.8  0.43  13.6    2.1  0.35   6.1
GX 1+4                262.991  -24.738 1.7    1.935   +4.813    6.9  0.43  16.1    0.0  0.00   0.0
IGR J17586-2129       269.633  -21.358 2.5    8.009   +1.351    5.2  0.48  10.7    0.0  0.00   0.0
GX 17+2               274.008  -14.001 2.6   16.464   +1.292   18.0  1.81  10.0    0.0  0.00   0.0
H 1820-303            275.895  -30.347 3.1    2.792   -7.888    4.8  0.58   8.3    0.0  0.00   0.0
GX 3+1                266.972  -26.564 3.5    2.288   +0.802    2.7  0.37   7.4    0.0  0.00   0.0
4U 1722-30            261.888  -30.801 3.6  356.320   +2.298    3.2  0.45   7.1    2.3  0.36   6.4
SLX 1735-269          264.573  -26.964 4.0    0.822   +2.415    2.5  0.39   6.3    0.0  0.00   0.0
OAO 1657-415          255.098  -41.659 4.1  344.318   +0.380   16.0  2.58   6.2    0.0  0.00   0.0
3A 1822-371           276.424  -37.062 4.7  356.882  -11.257    4.8  0.00   5.3    0.0  0.00   0.0
1E 1743.1-2843        266.613  -28.759 4.6    0.246   -0.063    1.9  0.35   5.4    0.0  0.00   0.0
GX 9+1                270.361  -20.520 4.7    9.074   +1.177    2.8  0.54   5.3    0.0  0.00   0.0
GRS 1747-312          267.776  -31.257 0.0  358.623   -2.213    1.7  0.00   4.3    0.0  0.00   0.0
XTE J1739-285         264.890  -28.449 6.4  359.715   +1.386    1.4  0.37   3.8    0.0  0.00   0.0
GX 354-0              262.914  -33.871 6.4  354.238   -0.118    1.8  0.48   3.8    0.0  0.00   0.0
IGR J17331-2406       263.149  -24.140 6.1    2.517   +5.016    1.6  0.00   4.0    0.0  0.00   0.0
IGR J17200-3116       260.128  -31.366 5.3  355.004   +3.228    2.2  0.47   4.7    0.0  0.00   0.0
PKS 1830-211          278.423  -21.049 6.8   12.179   -5.711    2.9  0.81   3.6    0.0  0.00   0.0
SAX J1712.6-3739      258.236  -37.639 7.2  348.982   +0.870    3.0  0.90   3.3    0.0  0.00   0.0
Swift J174535.5-2901  266.444  -29.121 0.0  359.860   -0.126    1.3  0.00   3.5    0.0  0.00   0.0
IGR J18027-2016       270.663  -20.247 7.1    9.451   +1.066    1.8  0.00   3.4    0.0  0.00   0.0
JEM-X
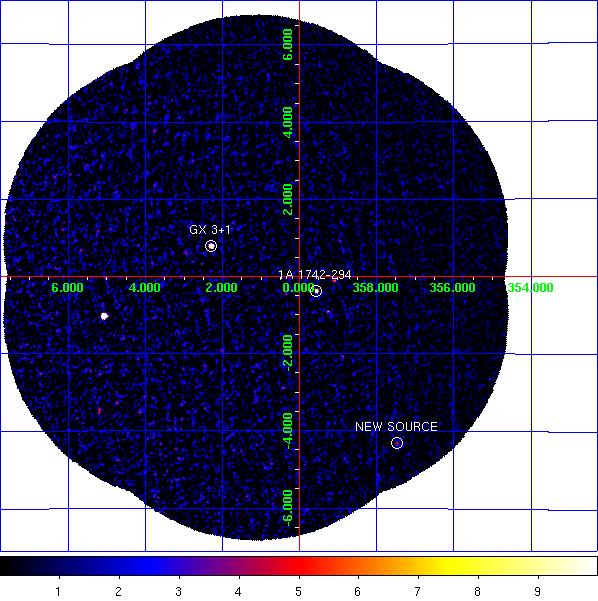
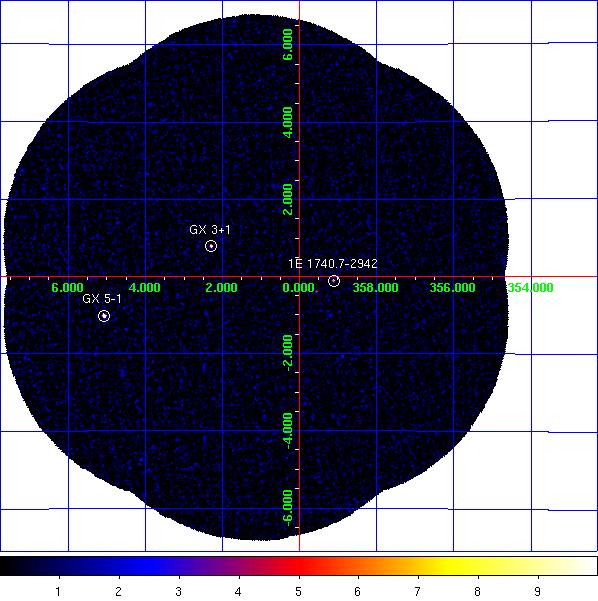
JEM-X1 significance mosaic images. Left: 3-10 keV. Right: 10-25 keV.
Sources labelled were detected in the 3-10 keV image > 6σ. The sources detected above 3σ in the 3-10 keV and/or 10-25 keV band are listed in the table below. Fluxes are extracted at the known catalogue position of the source (i.e. no fitting of the source position is done), with
mosaic_spec, in two bands: A = 3-10 keV (1 Crab ~ 97 cps [J1], 103 cps [J2]); B = 10-25 keV (1 Crab ~ 29 cps [J1], 27 cps [J2]). NOTES: The object marked as SLX 1744-299_300 is used to indicate two low-mass x-ray binaries separated by 2.7 arcminutes, SLX 1744-299 and SLX 1744-300; the position for SLX 1744-299 is used, although it can not be ruled out that SLX 1744-300 may dominate the emission some of the time. The systematic noise increases towards the edge of the field of view and in the vicinity of very bright sources, such as GX 5-1;
NEW SOURCEs < 6σ towards the border of the image and/or near GX 5-1 may, therefore, be spurious.
JEM-X1 Detected Sources in 3-10 keV (A) and 10-25 keV (B).
Source Name             RA       dec      l        b     A(cps)  +/-   sig  B(cps)  +/-   sig
==================== ========  ======= ======== ======== ====== ===== ===== ====== ===== =====
1A 1742-294           266.514  -29.505  359.564   -0.377    6.3  0.38  16.7    0.9  0.21   4.3
1E 1740.7-2942        265.978  -29.745  359.116   -0.106    0.0  0.00   0.0    1.6  0.23   6.7
1E 1743.1-2843        266.587  -28.729    0.260   -0.029    1.2  0.37   3.1    0.2  0.20   1.2
GX 3+1                266.985  -26.566    2.293   +0.791   33.7  0.49  68.3    3.2  0.23  13.9
GX 5-1                270.284  -25.079    5.077   -1.019    0.0  0.00   0.0   14.6  0.54  27.3
SLX 1744-299_300      266.858  -29.999  359.297   -0.889    1.6  0.41   4.0    0.3  0.23   1.1
NEW SOURCE            269.237  -33.319  357.464   -4.319    7.8  1.28   6.1    1.1  0.92   1.2
NEW SOURCE            269.459  -28.204    1.999   -1.933    2.8  0.47   6.0    0.0  0.00   0.0
NEW SOURCE            272.195  -27.118    4.136   -3.512    6.3  1.14   5.5    0.0  0.00   0.0
NEW SOURCE            265.024  -23.749    3.768   +3.777    5.3  1.08   4.9    0.8  0.57   1.5
NEW SOURCE            272.288  -26.475    4.740   -3.275    6.6  1.32   5.0    0.6  0.63   1.0
NEW SOURCE            267.532  -26.095    2.949   +0.614    2.6  0.51   5.2    0.5  0.24   1.9
NEW SOURCE            271.418  -27.973    3.053   -3.323    3.9  0.82   4.8    0.7  0.40   1.9
IGR J17511-3057       267.793  -30.969  358.879   -2.079    2.3  0.49   4.7    0.8  0.28   2.8