INTEGRAL Galactic bulge Monitoring
Revolution 0845: Observation start 2009-09-15T03:17 = MJD 55089.137
Total Observation GTI = 14656 seconds
IBIS/ISGRI
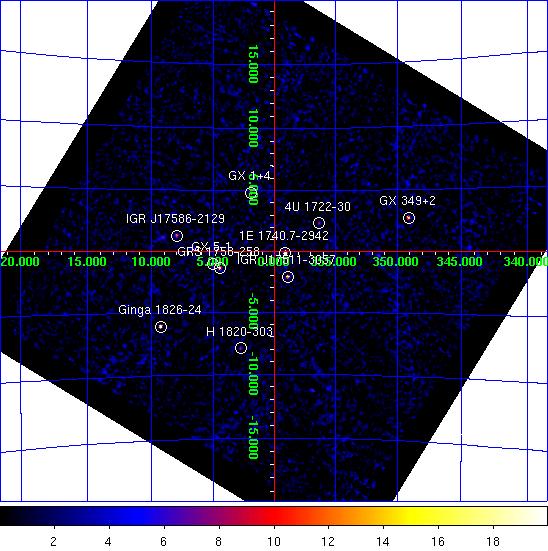
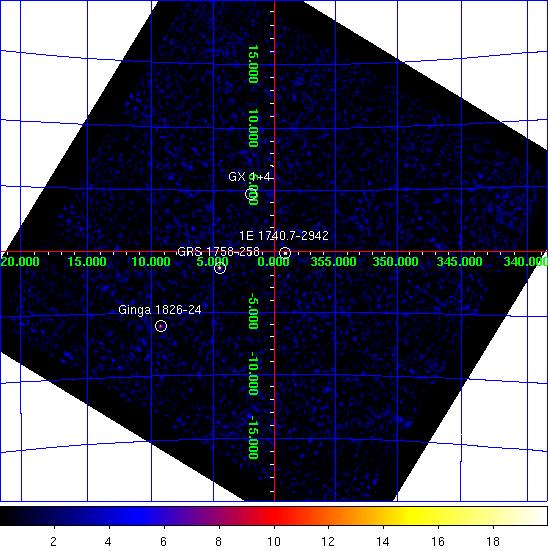
IBIS/ISGRI significance mosaic images. Left: IBIS/ISGRI 18-40 keV. Right: 40-100 keV
Sources detected > 10σ in each band are marked on the image. The table below lists the fitted position, and statistical positional uncertainty in arcmin returned by the mosaic step of
OSA10.1, of all the sources detected in the 18 - 40 keV range (band A: 1 Crab ~ 208 cps ) and 40 - 100 keV range (band B: 1 Crab ~ 100 cps ) where available.NOTES: The table is constructed from the
isgri_mosa_res.fits file - fluxes in the mosaic output are known to be systematically ~10% lower than in the ScW light-curves (see known issues). The systematic noise increases towards the edge of the field of view and NEW SOURCEs < 6σ towards the border of the image may be spurious. IBIS/ISGRI Detected Sources 18-40 keV (A) and 40-100 keV (B)
Source Name             RA       dec   +/-    l        b     A(cps)  +/-   sig  B(cps)  +/-   sig
==================== ========  ======= === ======== ======== ====== ===== ===== ====== ===== =====
GX 5-1                270.279  -25.083 0.9    5.072   -1.016   13.6  0.36  37.9    0.0  0.00   0.0
1E 1740.7-2942        265.967  -29.743 0.8  359.113   -0.096   11.6  0.29  39.2    8.6  0.25  34.2
GRS 1758-258          270.303  -25.754 1.2    4.499   -1.367    9.3  0.37  25.4    7.2  0.30  24.0
Ginga 1826-24         277.358  -23.783 1.1    9.281   -6.074   15.5  0.59  26.4    6.6  0.46  14.4
GX 1+4                263.001  -24.744 1.3    1.935   +4.802    8.5  0.36  23.7    0.0  0.00   0.0
IGR J17511-3057       267.803  -30.952 1.4  358.897   -2.078    7.4  0.36  20.5    2.5  0.30   8.3
GX 349+2              256.444  -36.434 1.5  349.099   +2.736   12.8  0.64  19.9    0.0  0.00   0.0
IGR J17586-2129       269.675  -21.393 2.1    7.997   +1.299    6.0  0.46  13.1    0.0  0.00   0.0
H 1820-303            275.902  -30.360 2.1    2.782   -7.900    6.6  0.51  12.8    0.0  0.00   0.0
4U 1722-30            261.872  -30.800 2.4  356.314   +2.311    4.1  0.37  11.0    1.5  0.30   5.1
GX 9+1                270.433  -20.487 3.5    9.136   +1.135    3.5  0.48   7.3    0.0  0.00   0.0
IGR J17252-3616       261.266  -36.294 3.8  351.473   -0.339    3.0  0.45   6.7    0.0  0.00   0.0
3A 1822-371           276.445  -37.078 3.3  356.875  -11.279    4.9  0.62   7.9    0.0  0.00   0.0
OAO 1657-415          255.209  -41.681 4.2  344.352   +0.301    7.7  1.27   6.0    0.0  0.00   0.0
GX 3+1                267.058  -26.568 3.9    2.325   +0.734    2.3  0.35   6.5    0.0  0.00   0.0
GX 17+2               273.986  -14.012 5.3   16.444   +1.306   12.5  2.71   4.6    0.0  0.00   0.0
SLX 1735-269          264.563  -26.996 4.5    0.790   +2.405    1.9  0.34   5.5    1.3  0.00   4.4
SLX 1744-299_300      266.871  -29.984 0.0  359.315   -0.891    1.4  0.00   4.6    0.0  0.00   0.0
SGR J1745-29          266.490  -29.080 5.6  359.916   -0.138    1.2  0.00   4.4    0.0  0.00   0.0
IGR J17098-3628       257.504  -36.516 0.0  349.544   +2.004    2.4  0.00   4.2    0.0  0.00   0.0
GRO J1655-40          253.355  -39.865 5.8  344.897   +2.530    4.7  0.00   4.2    0.0  0.00   0.0
JEM-X
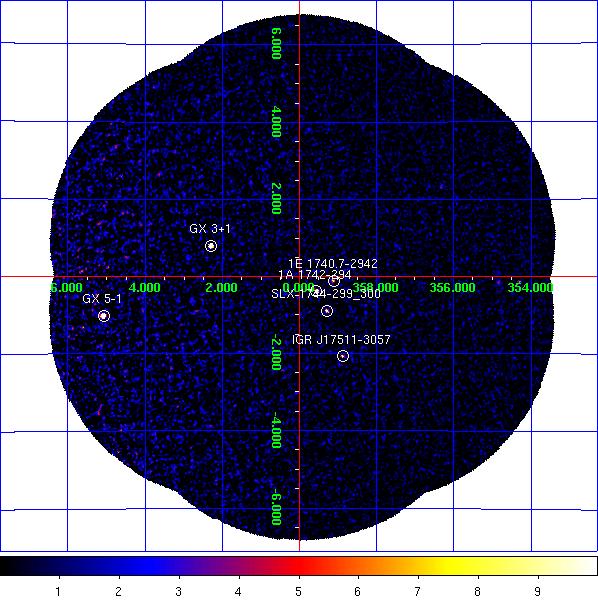
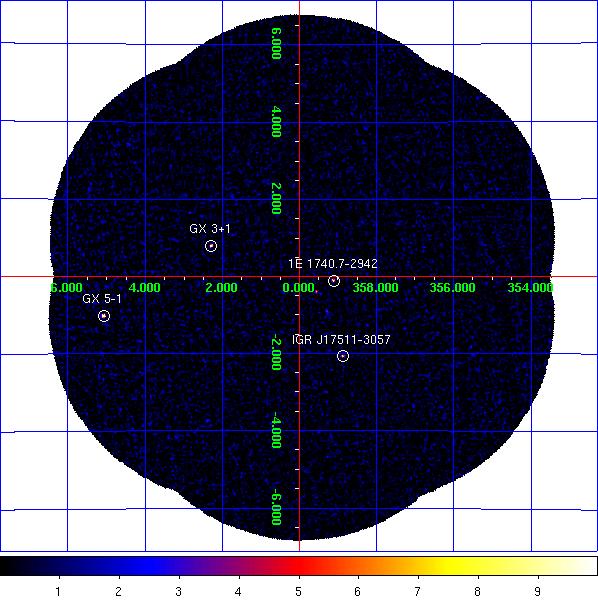
JEM-X1 significance mosaic images. Left: 3-10 keV. Right: 10-25 keV.
Sources labelled were detected in the 3-10 keV image > 6σ. The sources detected above 3σ in the 3-10 keV and/or 10-25 keV band are listed in the table below. Fluxes are extracted at the known catalogue position of the source (i.e. no fitting of the source position is done), with
mosaic_spec, in two bands: A = 3-10 keV (1 Crab ~ 97 cps [J1], 103 cps [J2]); B = 10-25 keV (1 Crab ~ 29 cps [J1], 27 cps [J2]). NOTES: The object marked as SLX 1744-299_300 is used to indicate two low-mass x-ray binaries separated by 2.7 arcminutes, SLX 1744-299 and SLX 1744-300; the position for SLX 1744-299 is used, although it can not be ruled out that SLX 1744-300 may dominate the emission some of the time. The systematic noise increases towards the edge of the field of view and in the vicinity of very bright sources, such as GX 5-1;
NEW SOURCEs < 6σ towards the border of the image and/or near GX 5-1 may, therefore, be spurious.
JEM-X1 Detected Sources in 3-10 keV (A) and 10-25 keV (B).
Source Name             RA       dec      l        b     A(cps)  +/-   sig  B(cps)  +/-   sig
==================== ========  ======= ======== ======== ====== ===== ===== ====== ===== =====
1A 1742-294           266.518  -29.512  359.559   -0.384    6.1  0.24  25.2    0.8  0.16   5.2
1E 1740.7-2942        265.978  -29.745  359.116   -0.106    2.0  0.24   8.5    1.4  0.16   8.7
4U 1722-30            261.888  -30.802  356.320   +2.298    1.8  0.51   3.6    0.7  0.44   1.7
GX 3+1                266.981  -26.567    2.289   +0.794   29.0  0.43  67.5    2.9  0.24  12.0
GX 354-0              262.989  -33.835  354.302   -0.150    5.1  0.85   6.0    0.0  0.00   0.0
GX 5-1                270.286  -25.077    5.079   -1.019  122.3  1.79  68.3   16.0  0.87  18.4
IGR J17511-3057       267.778  -30.969  358.872   -2.068    2.3  0.25   9.0    1.3  0.18   7.0
MXB 1730-335          263.350  -33.388  354.841   -0.158    3.0  0.58   5.2    0.6  0.45   1.2
SLX 1744-299_300      266.858  -29.999  359.297   -0.889    3.1  0.24  13.0    0.6  0.16   3.4
NEW SOURCE            270.869  -24.768    5.609   -1.327   11.3  2.10   5.4    1.8  1.19   1.5
NEW SOURCE            269.509  -24.010    5.654   +0.125    9.9  1.79   5.5    0.0  0.00   0.0
NEW SOURCE            269.035  -24.552    4.968   +0.228    6.2  1.23   5.1    1.1  0.65   1.7
NEW SOURCE            272.795  -26.180    5.218   -3.532   17.5  3.04   5.8    0.0  0.00   0.0
NEW SOURCE            271.032  -24.542    5.879   -1.344   13.6  2.83   4.8    2.5  1.57   1.6
NEW SOURCE            269.857  -24.649    5.258   -0.469    7.7  1.54   5.0    0.0  0.00   0.0
NEW SOURCE            271.063  -25.405    5.141   -1.792    9.0  1.71   5.3    0.0  0.00   0.0
NEW SOURCE            265.740  -23.369    4.437   +3.419    3.7  1.49   2.5    3.1  0.99   3.1