INTEGRAL Galactic bulge Monitoring
Revolution 0789: Observation start 2009-03-30T10:14 = MJD 54920.427
Total Observation GTI = 11381 seconds
IBIS/ISGRI
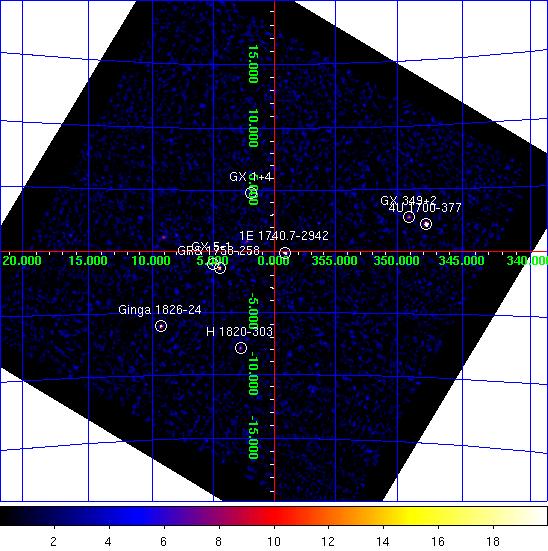
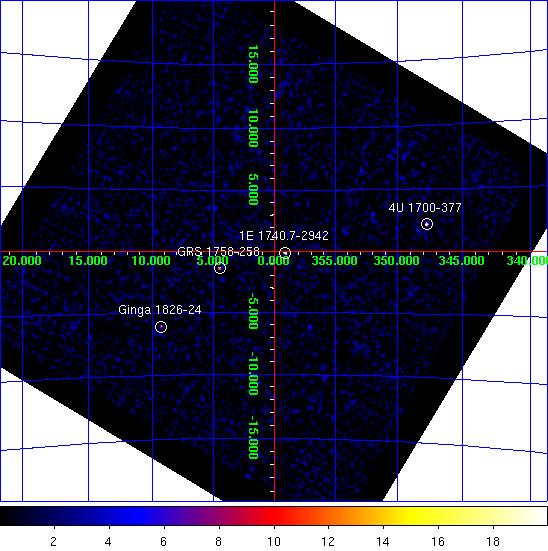
IBIS/ISGRI significance mosaic images. Left: IBIS/ISGRI 18-40 keV. Right: 40-100 keV
Sources detected > 10σ in each band are marked on the image. The table below lists the fitted position, and statistical positional uncertainty in arcmin returned by the mosaic step of
OSA10.1, of all the sources detected in the 18 - 40 keV range (band A: 1 Crab ~ 208 cps ) and 40 - 100 keV range (band B: 1 Crab ~ 100 cps ) where available.NOTES: The table is constructed from the
isgri_mosa_res.fits file - fluxes in the mosaic output are known to be systematically ~10% lower than in the ScW light-curves (see known issues). The systematic noise increases towards the edge of the field of view and NEW SOURCEs < 6σ towards the border of the image may be spurious. IBIS/ISGRI Detected Sources 18-40 keV (A) and 40-100 keV (B)
Source Name             RA       dec   +/-    l        b     A(cps)  +/-   sig  B(cps)  +/-   sig
==================== ========  ======= === ======== ======== ====== ===== ===== ====== ===== =====
4U 1700-377           255.983  -37.844 0.6  347.753   +2.175   57.8  0.97  59.4   17.9  0.76  23.7
GX 5-1                270.278  -25.078 0.8    5.076   -1.013   16.6  0.39  42.8    0.0  0.00   0.0
1E 1740.7-2942        265.989  -29.754 1.1  359.114   -0.118   10.0  0.36  27.5    7.7  0.31  24.6
GRS 1758-258          270.294  -25.737 1.2    4.510   -1.352    8.6  0.36  24.2    5.6  0.29  19.2
Ginga 1826-24         277.360  -23.796 1.3    9.270   -6.081   14.8  0.63  23.5    6.9  0.49  14.0
GX 1+4                263.006  -24.756 1.3    1.927   +4.791   10.4  0.45  23.0    0.0  0.00   0.0
H 1820-303            275.910  -30.354 2.0    2.791   -7.903    6.9  0.51  13.7    0.0  0.00   0.0
GX 349+2              256.437  -36.420 2.1  349.107   +2.749   10.5  0.81  13.0    0.0  0.00   0.0
GX 9+1                270.366  -20.551 2.7    9.049   +1.158    4.8  0.49   9.8    0.0  0.00   0.0
GX 3+1                266.974  -26.559 2.8    2.293   +0.803    3.5  0.37   9.4    0.0  0.00   0.0
4U 1722-30            261.880  -30.765 3.4  356.347   +2.325    3.1  0.41   7.6    1.5  0.33   4.7
GX 17+2               273.993  -14.057 3.4   16.407   +1.279   14.8  1.98   7.5    0.0  0.00   0.0
IGR J17586-2129       269.659  -21.366 3.9    8.013   +1.326    3.1  0.48   6.4    0.0  0.00   0.0
3A 1822-371           276.463  -37.095 0.0  356.866  -11.300    3.8  0.00   4.8    0.0  0.00   0.0
3A 1728-169           262.948  -17.050 5.4    8.444   +8.980    3.5  0.78   4.5    0.0  0.00   0.0
AX J1740.1-3102       265.129  -31.116 5.6  357.565   -0.206    1.9  0.00   4.4    0.0  0.00   0.0
XTE J1709-267         257.322  -26.684 5.5  357.420   +7.934    2.5  0.56   4.5    0.0  0.00   0.0
1E 1742.8-2853        266.557  -28.942 7.2    0.064   -0.116    1.2  0.38   3.3    0.0  0.00   0.0
GRS 1747-312          267.807  -31.303 5.4  358.597   -2.260    1.9  0.41   4.5    0.0  0.00   0.0
XB 1832-330           278.948  -33.041 5.9    1.490  -11.404    2.9  0.70   4.1    0.0  0.00   0.0
1H 1746-370           267.497  -37.086 5.6  353.479   -4.984    2.6  0.59   4.3    0.0  0.00   0.0
1A 1742-294           266.576  -29.488 0.0  359.607   -0.415    1.4  0.00   3.9    0.0  0.00   0.0
SLX 1744-299_300      266.931  -30.025 6.8  359.307   -0.957    1.2  0.34   3.5    0.0  0.00   0.0
JEM-X
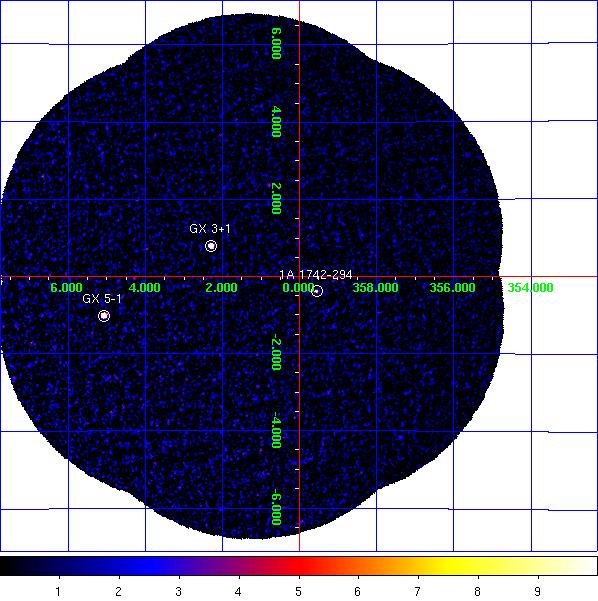
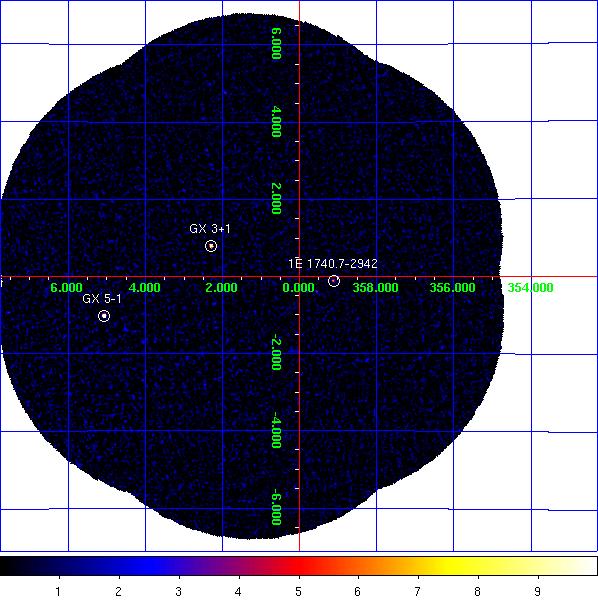
JEM-X1 significance mosaic images. Left: 3-10 keV. Right: 10-25 keV.
Sources labelled were detected in the 3-10 keV image > 6σ. The sources detected above 3σ in the 3-10 keV and/or 10-25 keV band are listed in the table below. Fluxes are extracted at the known catalogue position of the source (i.e. no fitting of the source position is done), with
mosaic_spec, in two bands: A = 3-10 keV (1 Crab ~ 97 cps [J1], 103 cps [J2]); B = 10-25 keV (1 Crab ~ 29 cps [J1], 27 cps [J2]). NOTES: The object marked as SLX 1744-299_300 is used to indicate two low-mass x-ray binaries separated by 2.7 arcminutes, SLX 1744-299 and SLX 1744-300; the position for SLX 1744-299 is used, although it can not be ruled out that SLX 1744-300 may dominate the emission some of the time. The systematic noise increases towards the edge of the field of view and in the vicinity of very bright sources, such as GX 5-1;
NEW SOURCEs < 6σ towards the border of the image and/or near GX 5-1 may, therefore, be spurious.
JEM-X1 Detected Sources in 3-10 keV (A) and 10-25 keV (B).
Source Name             RA       dec      l        b     A(cps)  +/-   sig  B(cps)  +/-   sig
==================== ========  ======= ======== ======== ====== ===== ===== ====== ===== =====
1A 1742-294           266.510  -29.514  359.555   -0.379    4.1  0.33  12.4    0.7  0.19   3.5
1E 1740.7-2942        265.978  -29.745  359.116   -0.106    1.1  0.35   3.1    1.3  0.21   6.2
GRS 1758-258          270.303  -25.741    4.511   -1.361    2.5  0.76   3.2    1.2  0.39   3.0
GX 3+1                266.981  -26.568    2.289   +0.793   39.9  0.44  91.4    4.5  0.22  20.8
GX 5-1                270.284  -25.079    5.077   -1.019  107.6  1.13  94.8   15.2  0.51  30.0
SLX 1735-269          264.571  -26.994    0.796   +2.400    1.7  0.40   4.3    0.3  0.22   1.5
NEW SOURCE            266.947  -24.302    4.214   +1.990    2.8  0.70   4.0    0.0  0.00   0.0
NEW SOURCE            267.749  -21.901    6.655   +2.589   11.2  2.44   4.6    0.0  0.00   0.0
NEW SOURCE            268.921  -25.281    4.286   -0.051    2.5  0.65   3.9    0.0  0.00   0.0
NEW SOURCE            270.419  -27.408    3.111   -2.275    2.6  0.58   4.6    0.0  0.00   0.0
NEW SOURCE            266.816  -22.180    5.971   +3.189    9.2  1.93   4.8    0.0  0.00   0.0
NEW SOURCE            268.034  -25.160    3.984   +0.702    2.3  0.58   4.0    0.0  0.00   0.0