INTEGRAL Galactic bulge Monitoring
Revolution 0718: Observation start 2008-08-30T00:29 = MJD 54708.021
Total Observation GTI = 12149 seconds
IBIS/ISGRI
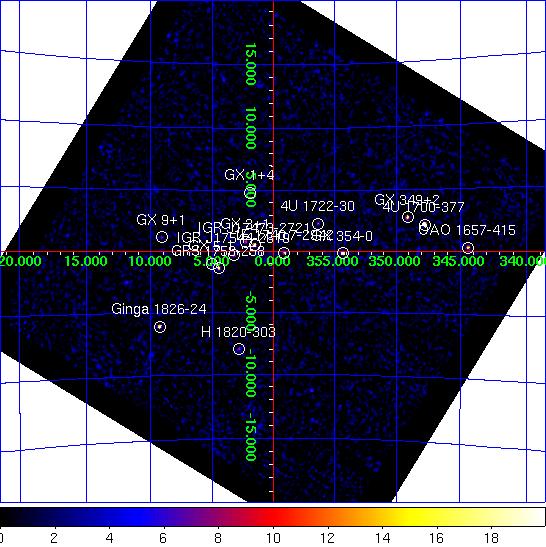
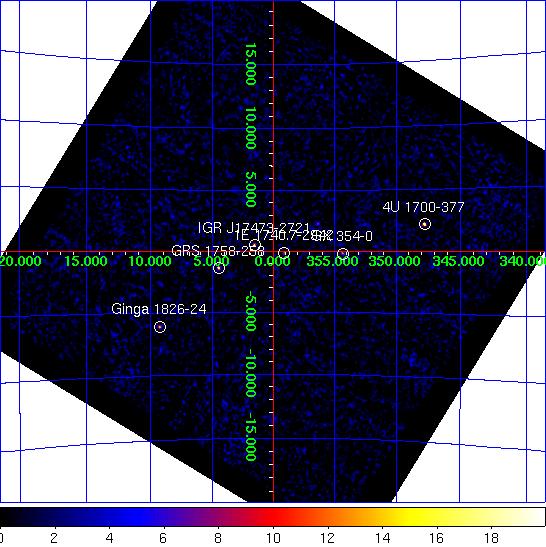
IBIS/ISGRI significance mosaic images. Left: IBIS/ISGRI 18-40 keV. Right: 40-100 keV
Sources detected > 10σ in each band are marked on the image. The table below lists the fitted position, and statistical positional uncertainty in arcmin returned by the mosaic step of
OSA10.1, of all the sources detected in the 18 - 40 keV range (band A: 1 Crab ~ 208 cps ) and 40 - 100 keV range (band B: 1 Crab ~ 100 cps ) where available.NOTES: The table is constructed from the
isgri_mosa_res.fits file - fluxes in the mosaic output are known to be systematically ~10% lower than in the ScW light-curves (see known issues). The systematic noise increases towards the edge of the field of view and NEW SOURCEs < 6σ towards the border of the image may be spurious. IBIS/ISGRI Detected Sources 18-40 keV (A) and 40-100 keV (B)
Source Name             RA       dec   +/-    l        b     A(cps)  +/-   sig  B(cps)  +/-   sig
==================== ========  ======= === ======== ======== ====== ===== ===== ====== ===== =====
4U 1700-377           255.994  -37.846 0.6  347.757   +2.168   56.0  0.83  67.4   14.8  0.63  23.6
IGR J17473-2721       266.827  -27.342 0.8    1.556   +0.510   14.0  0.33  41.9    6.3  0.29  22.0
GX 354-0              262.993  -33.830 0.8  354.308   -0.150   17.7  0.40  44.2    4.9  0.33  15.1
GX 5-1                270.279  -25.083 1.1    5.072   -1.016   11.8  0.42  27.7    0.0  0.00   0.0
Ginga 1826-24         277.369  -23.789 1.1    9.281   -6.085   17.9  0.64  27.9    7.2  0.50  14.3
GRS 1758-258          270.300  -25.748 1.1    4.503   -1.363   11.0  0.42  26.4    7.5  0.34  22.1
GX 349+2              256.417  -36.425 1.3  349.093   +2.759   15.2  0.68  22.5    0.0  0.00   0.0
OAO 1657-415          255.217  -41.661 1.6  344.371   +0.309   26.0  1.45  17.9    5.0  1.10   4.5
1E 1740.7-2942        265.966  -29.741 1.6  359.114   -0.094    6.2  0.35  17.9    4.2  0.29  14.4
GX 1+4                262.996  -24.730 1.6    1.944   +4.813    8.1  0.44  18.3    0.0  0.00   0.0
IGR J17544-2619       268.592  -26.336 1.9    3.225   -0.328    4.9  0.35  14.1    0.0  0.00   0.0
4U 1722-30            261.890  -30.805 2.1  356.318   +2.295    5.0  0.38  13.1    3.0  0.31   9.7
GX 3+1                266.987  -26.560 2.1    2.299   +0.793    4.3  0.34  12.7    0.0  0.00   0.0
H 1820-303            275.995  -30.360 2.6    2.819   -7.972    5.4  0.53  10.3    0.0  0.00   0.0
GX 9+1                270.402  -20.520 2.6    9.092   +1.144    5.2  0.51  10.1    0.0  0.00   0.0
3A 1822-371           276.431  -37.086 3.6  356.863  -11.272    5.3  0.74   7.2    0.0  0.00   0.0
SLX 1735-269          264.600  -27.024 3.3    0.784   +2.363    2.8  0.36   7.8    0.0  0.00   0.0
1A 1742-294           266.458  -29.482 4.1  359.558   -0.323    1.9  0.31   6.1    0.0  0.00   0.0
H 1702-429            256.576  -43.063 4.3  343.870   -1.342   12.8  2.18   5.9    0.0  0.00   0.0
GX 17+2               274.054  -13.980 4.1   16.504   +1.263   18.5  3.05   6.1    0.0  0.00   0.0
GRS 1734-292          264.410  -29.082 4.7  358.954   +1.404    1.7  0.33   5.2    0.0  0.00   0.0
IGR J17252-3616       261.316  -36.246 5.1  351.536   -0.346    2.4  0.49   4.9    0.0  0.00   0.0
XTE J1716-389         258.828  -38.775 0.0  348.333   -0.172    3.0  0.00   4.3    0.0  0.00   0.0
SLX 1744-299_300      266.813  -29.998 4.9  359.278   -0.855    1.6  0.32   5.0    0.0  0.00   0.0
IGR J17586-2129       269.632  -21.282 6.2    8.074   +1.389    1.9  0.00   3.9    0.0  0.00   0.0
3A 1728-169           262.950  -16.973 6.3    8.512   +9.019    3.2  0.00   3.9    0.0  0.00   0.0
IGR J18027-2016       270.724  -20.212 0.0    9.509   +1.033    2.1  0.00   3.8    0.0  0.00   0.0
XTE J1710-281         257.534  -28.121 7.8  356.357   +6.941    1.6  0.54   3.1    0.0  0.00   0.0
SAX J1712.6-3739      258.129  -37.606 6.7  348.959   +0.957    2.3  0.63   3.6    0.0  0.00   0.0
GX 13+1               273.693  -17.233 6.4   13.478   +0.018    3.5  0.93   3.8    0.0  0.00   0.0
1E 1742.8-2853        266.585  -29.002 0.0    0.026   -0.169    1.1  0.00   3.5    0.0  0.00   0.0
JEM-X
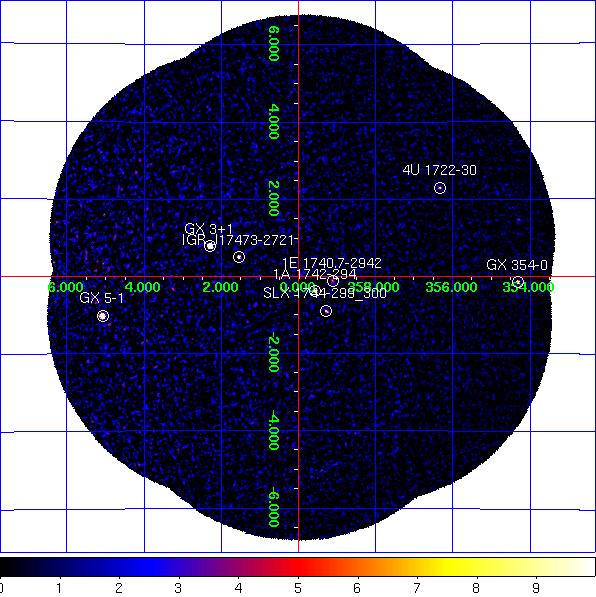
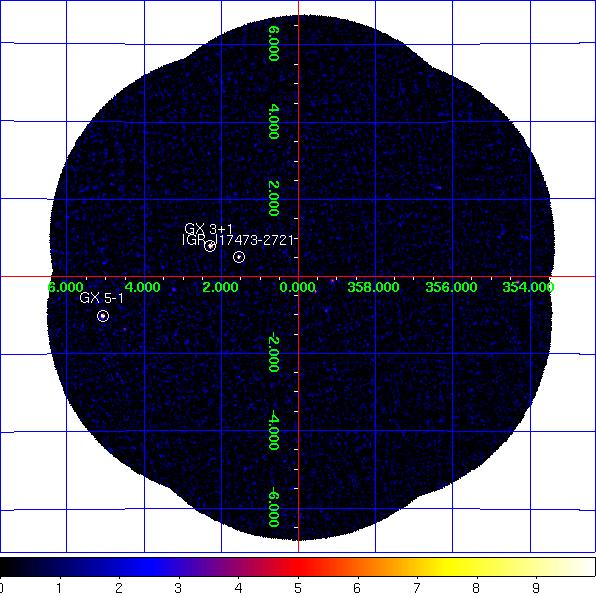
JEM-X1+2 combined significance mosaic images. Left: 3-10 keV. Right: 10-25 keV.
Sources labelled were detected in the 3-10 keV image > 6σ. The sources detected above 3σ in the 3-10 keV and/or 10-25 keV band are listed in the table below. Fluxes are extracted at the known catalogue position of the source (i.e. no fitting of the source position is done), with
mosaic_spec, in two bands: A = 3-10 keV (1 Crab ~ 97 cps [J1], 103 cps [J2]); B = 10-25 keV (1 Crab ~ 29 cps [J1], 27 cps [J2]). NOTES: The object marked as SLX 1744-299_300 is used to indicate two low-mass x-ray binaries separated by 2.7 arcminutes, SLX 1744-299 and SLX 1744-300; the position for SLX 1744-299 is used, although it can not be ruled out that SLX 1744-300 may dominate the emission some of the time. The systematic noise increases towards the edge of the field of view and in the vicinity of very bright sources, such as GX 5-1;
NEW SOURCEs < 6σ towards the border of the image and/or near GX 5-1 may, therefore, be spurious.
JEM-X1+2 Detected Sources in 3-10 keV (A) and 10-25 keV (B).
Source Name             RA       dec      l        b     A(cps)  +/-   sig  B(cps)  +/-   sig
==================== ========  ======= ======== ======== ====== ===== ===== ====== ===== =====
1A 1742-294           266.523  -29.515  359.559   -0.389    3.0  0.23  13.1    0.7  0.14   4.8
1E 1740.7-2942        265.978  -29.745  359.116   -0.106    1.5  0.23   6.6    0.8  0.15   5.6
4U 1722-30            261.888  -30.802  356.320   +2.298    3.3  0.43   7.7    0.9  0.33   2.8
GRS 1758-258          270.303  -25.741    4.511   -1.361    2.8  0.91   3.1    1.7  0.47   3.5
GX 3+1                266.983  -26.567    2.291   +0.792   46.1  0.40 115.0    5.1  0.21  24.6
GX 354-0              262.991  -33.830  354.307   -0.149   12.7  0.86  14.9    4.2  0.70   6.0
GX 5-1                270.288  -25.077    5.081   -1.020  130.7  1.52  85.7   14.9  0.71  21.0
IGR J17473-2721       266.833  -27.351    1.551   +0.501    5.2  0.30  17.4    2.1  0.17  12.4
SLX 1744-299_300      266.858  -29.999  359.297   -0.889    1.7  0.23   7.3    0.4  0.15   2.8
IGR J17544-2619       268.601  -26.300    3.261   -0.317    2.3  0.48   4.8    0.9  0.26   3.5
NEW SOURCE            270.412  -25.340    4.908   -1.248    5.7  1.23   4.6    0.0  0.00   0.0
NEW SOURCE            270.042  -24.768    5.238   -0.673    5.6  1.42   4.0    1.4  0.76   1.8
NEW SOURCE            268.955  -24.429    5.038   +0.352    3.7  1.10   3.4    1.5  0.59   2.5
NEW SOURCE            270.011  -24.798    5.198   -0.664    4.8  1.37   3.5    1.8  0.72   2.5