INTEGRAL Galactic bulge Monitoring
Revolution 0670: Observation start 2008-04-08T10:17 = MJD 54564.429
Total Observation GTI = 22388 seconds
IBIS/ISGRI
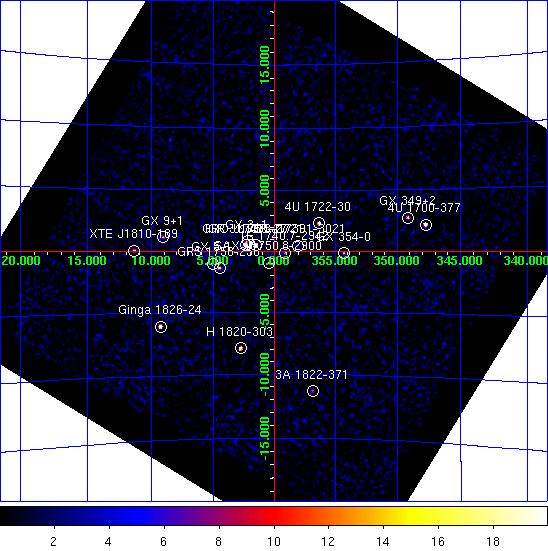

IBIS/ISGRI significance mosaic images. Left: IBIS/ISGRI 18-40 keV. Right: 40-100 keV
Sources detected > 10σ in each band are marked on the image. The table below lists the fitted position, and statistical positional uncertainty in arcmin returned by the mosaic step of
OSA10.1, of all the sources detected in the 18 - 40 keV range (band A: 1 Crab ~ 208 cps ) and 40 - 100 keV range (band B: 1 Crab ~ 100 cps ) where available.NOTES: The table is constructed from the
isgri_mosa_res.fits file - fluxes in the mosaic output are known to be systematically ~10% lower than in the ScW light-curves (see known issues). The systematic noise increases towards the edge of the field of view and NEW SOURCEs < 6σ towards the border of the image may be spurious. IBIS/ISGRI Detected Sources 18-40 keV (A) and 40-100 keV (B)
Source Name             RA       dec   +/-    l        b     A(cps)  +/-   sig  B(cps)  +/-   sig
==================== ========  ======= === ======== ======== ====== ===== ===== ====== ===== =====
IGR J17473-2721       266.827  -27.341 0.5    1.556   +0.511   22.8  0.26  88.7   11.6  0.20  57.2
GRO J1750-27          267.287  -26.642 0.6    2.366   +0.520   17.2  0.30  58.0    0.0  0.00   0.0
4U 1700-377           255.999  -37.859 0.8  347.749   +2.157   22.2  0.52  42.2    6.6  0.39  16.7
GX 5-1                270.274  -25.082 0.8    5.070   -1.012   12.6  0.30  42.0    0.0  0.00   0.0
H 1820-303            275.913  -30.366 0.8    2.781   -7.911   16.4  0.41  39.7    0.0  0.00   0.0
Ginga 1826-24         277.360  -23.788 0.9    9.278   -6.078   19.1  0.52  36.8    7.9  0.38  20.8
4U 1722-30            261.888  -30.797 0.9  356.324   +2.302    9.0  0.27  33.5    3.7  0.21  17.6
GRS 1758-258          270.303  -25.738 1.4    4.513   -1.359    6.1  0.29  21.0    3.9  0.22  17.3
GX 349+2              256.461  -36.412 1.4  349.124   +2.739    9.4  0.46  20.6    0.0  0.00   0.0
XTE J1810-189         272.582  -19.052 1.4   11.375   +0.072   10.0  0.50  20.0    3.7  0.37   9.9
SAX J1750.8-2900      267.580  -29.053 1.6    0.431   -0.940    4.9  0.27  18.0    2.5  0.21  12.1
1E 1740.7-2942        265.964  -29.753 1.7  359.103   -0.099    4.1  0.25  16.4    2.6  0.20  13.1
GX 354-0              262.985  -33.845 1.6  354.292   -0.153    4.7  0.27  17.3    0.0  0.00   0.0
GX 9+1                270.380  -20.532 2.1    9.072   +1.156    5.1  0.41  12.7    0.0  0.00   0.0
GX 3+1                266.886  -26.601 2.4    2.217   +0.849    3.3  0.00  11.3    0.0  0.00   0.0
3A 1822-371           276.476  -37.099 2.3  356.866  -11.310    6.6  0.56  11.7    0.0  0.00   0.0
IGR J17391-3021       264.796  -30.320 2.6  358.087   +0.459    2.9  0.28  10.3    0.0  0.00   0.0
SLX 1735-269          264.579  -27.036 3.8    0.764   +2.372    1.6  0.25   6.6    1.3  0.19   6.6
3A 1728-169           262.956  -16.992 3.4    8.498   +9.004    5.0  0.66   7.6    0.0  0.00   0.0
IGR J18027-2016       270.732  -20.272 0.0    9.461   +0.997    2.8  0.00   7.0    0.0  0.00   0.0
SLX 1744-299_300      266.812  -29.957 3.8  359.311   -0.833    1.7  0.25   6.6    0.9  0.20   4.6
XTE J1709-267         257.332  -26.668 4.7  357.439   +7.936    1.9  0.36   5.3    0.0  0.00   0.0
SAX J1810.8-2609      272.663  -26.087 5.3    5.243   -3.383    1.5  0.32   4.6    0.0  0.00   0.0
SLX 1737-282          265.177  -28.299 7.5  359.975   +1.252    0.9  0.27   3.2    0.0  0.00   0.0
GX 1+4                262.994  -24.792 5.5    1.890   +4.781    1.4  0.31   4.5    0.0  0.00   0.0
1A 1743-288           266.734  -28.882 7.5    0.196   -0.218    0.8  0.27   3.2    0.0  0.00   0.0
Swift J171707.3-3640  259.366  -36.651 6.8  350.310   +0.713    1.4  0.00   3.6    0.0  0.00   0.0
H 1702-429            256.620  -43.021 6.7  343.924   -1.342    6.5  1.79   3.6    0.0  0.00   0.0
MAXI J1836-194        279.035  -19.305 7.0   14.004   -5.435    3.2  0.00   3.5    0.0  0.00   0.0
IGR J17448-3232       266.316  -32.551 6.9  356.875   -1.819    1.0  0.29   3.5    0.0  0.00   0.0
IGR J17200-3116       260.046  -31.260 5.6  355.052   +3.345    1.3  0.30   4.4    0.0  0.00   0.0
JEM-X

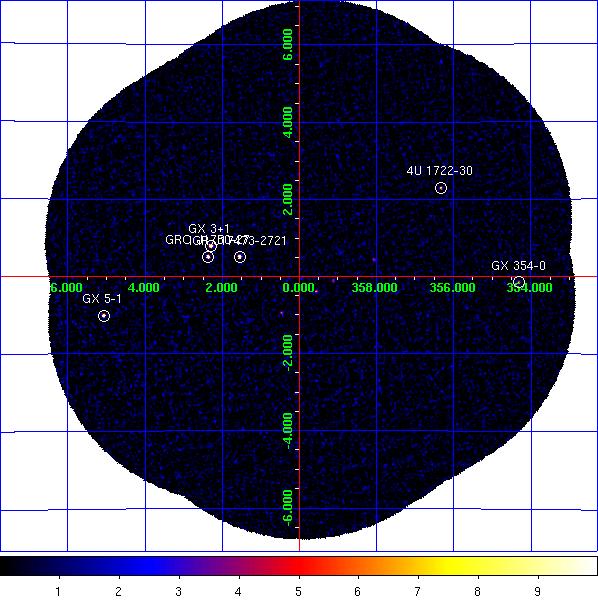
JEM-X1 significance mosaic images. Left: 3-10 keV. Right: 10-25 keV.
Sources labelled were detected in the 3-10 keV image > 6σ. The sources detected above 3σ in the 3-10 keV and/or 10-25 keV band are listed in the table below. Fluxes are extracted at the known catalogue position of the source (i.e. no fitting of the source position is done), with
mosaic_spec, in two bands: A = 3-10 keV (1 Crab ~ 97 cps [J1], 103 cps [J2]); B = 10-25 keV (1 Crab ~ 29 cps [J1], 27 cps [J2]). NOTES: The object marked as SLX 1744-299_300 is used to indicate two low-mass x-ray binaries separated by 2.7 arcminutes, SLX 1744-299 and SLX 1744-300; the position for SLX 1744-299 is used, although it can not be ruled out that SLX 1744-300 may dominate the emission some of the time. The systematic noise increases towards the edge of the field of view and in the vicinity of very bright sources, such as GX 5-1;
NEW SOURCEs < 6σ towards the border of the image and/or near GX 5-1 may, therefore, be spurious.
JEM-X1 Detected Sources in 3-10 keV (A) and 10-25 keV (B).
Source Name             RA       dec      l        b     A(cps)  +/-   sig  B(cps)  +/-   sig
==================== ========  ======= ======== ======== ====== ===== ===== ====== ===== =====
1A 1742-294           266.541  -29.495  359.585   -0.393    5.2  0.25  20.7    0.7  0.15   4.8
1E 1740.7-2942        265.978  -29.745  359.116   -0.106    1.0  0.23   4.4    0.7  0.14   4.6
1E 1743.1-2843        266.587  -28.729    0.260   -0.029    1.2  0.26   4.7    0.3  0.15   1.7
4U 1722-30            261.888  -30.802  356.320   +2.298    3.9  0.39  10.2    1.9  0.27   7.0
GRO J1750-27          267.300  -26.645    2.370   +0.509    5.1  0.40  12.8    4.6  0.22  20.4
GRS 1734-292          264.367  -29.142  358.883   +1.404    0.8  0.24   3.5    0.2  0.15   1.0
GRS 1747-312          267.690  -31.292  358.555   -2.168    1.7  0.30   5.9    0.3  0.19   1.5
GX 3+1                266.987  -26.559    2.300   +0.793   48.4  0.44 109.8    5.9  0.23  26.1
GX 354-0              262.989  -33.835  354.302   -0.150   15.3  0.73  20.9    3.7  0.55   6.7
GX 5-1                270.280  -25.074    5.080   -1.013  127.0  1.92  66.1   15.7  0.94  16.7
IGR J17391-3021       264.802  -30.339  358.074   +0.445    0.9  0.23   3.9    0.7  0.15   4.7
IGR J17473-2721       266.835  -27.356    1.547   +0.497    6.6  0.32  20.4    3.3  0.19  17.8
SLX 1735-269          264.571  -26.994    0.796   +2.400    1.6  0.31   5.3    0.3  0.18   1.7
SLX 1744-299_300      266.858  -29.999  359.297   -0.889    2.1  0.25   8.2    0.3  0.15   1.7
Swift J174535.5-2901  266.398  -29.026  359.920   -0.042    0.7  0.24   3.1    0.3  0.14   2.4
SAX J1750.8-2900      267.605  -29.032    0.460   -0.948    1.9  0.28   6.6    0.8  0.16   4.9
NEW SOURCE            267.624  -22.818    5.807   +2.221   13.1  2.62   5.0    0.0  0.00   0.0