INTEGRAL Galactic bulge Monitoring
Revolution 0664: Observation start 2008-03-22T18:10 = MJD 54547.758
Total Observation GTI = 13696 seconds
IBIS/ISGRI
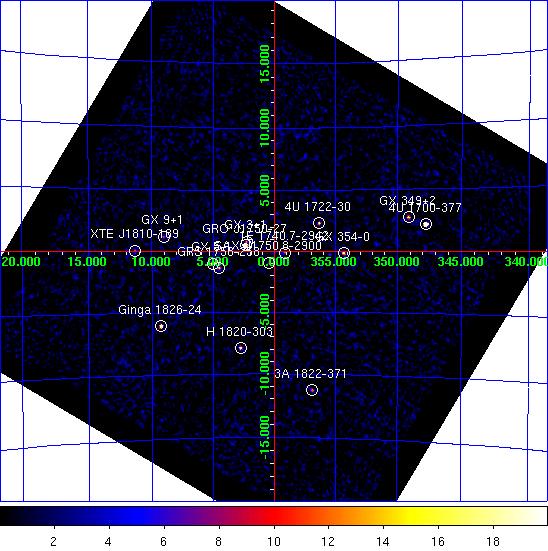
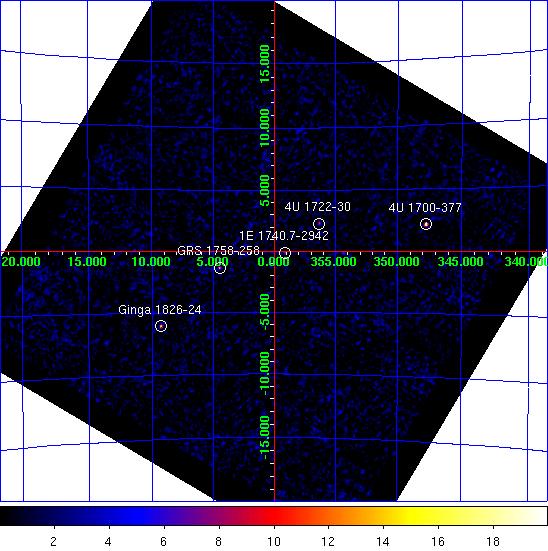
IBIS/ISGRI significance mosaic images. Left: IBIS/ISGRI 18-40 keV. Right: 40-100 keV
Sources detected > 10σ in each band are marked on the image. The table below lists the fitted position, and statistical positional uncertainty in arcmin returned by the mosaic step of
OSA10.1, of all the sources detected in the 18 - 40 keV range (band A: 1 Crab ~ 208 cps ) and 40 - 100 keV range (band B: 1 Crab ~ 100 cps ) where available.NOTES: The table is constructed from the
isgri_mosa_res.fits file - fluxes in the mosaic output are known to be systematically ~10% lower than in the ScW light-curves (see known issues). The systematic noise increases towards the edge of the field of view and NEW SOURCEs < 6σ towards the border of the image may be spurious. IBIS/ISGRI Detected Sources 18-40 keV (A) and 40-100 keV (B)
Source Name             RA       dec   +/-    l        b     A(cps)  +/-   sig  B(cps)  +/-   sig
==================== ========  ======= === ======== ======== ====== ===== ===== ====== ===== =====
GRO J1750-27          267.302  -26.642 0.5    2.374   +0.509   25.6  0.31  81.7    1.3  0.25   5.2
4U 1700-377           255.985  -37.844 0.5  347.754   +2.174   68.4  0.84  81.5   16.0  0.60  26.8
GX 5-1                270.279  -25.074 0.7    5.079   -1.011   16.2  0.33  49.1    0.0  0.00   0.0
Ginga 1826-24         277.359  -23.791 0.9    9.274   -6.078   19.2  0.54  35.9    6.7  0.40  16.7
H 1820-303            275.916  -30.361 1.1    2.787   -7.911   12.9  0.45  28.9    0.0  0.00   0.0
GX 354-0              263.005  -33.824 1.3  354.318   -0.156    8.3  0.38  22.1    2.5  0.29   8.7
4U 1722-30            261.891  -30.791 1.4  356.330   +2.302    8.7  0.40  21.5    3.6  0.30  11.8
GRS 1758-258          270.324  -25.729 0.0    4.530   -1.372    5.3  0.00  16.5    3.6  0.25  14.7
GX 349+2              256.454  -36.409 1.6  349.124   +2.744   13.0  0.72  18.2    0.0  0.00   0.0
GX 3+1                266.945  -26.570 0.0    2.271   +0.820    4.3  0.00  13.4    0.0  0.00   0.0
3A 1822-371           276.461  -37.070 2.0  356.888  -11.287    7.5  0.54  13.7    0.0  0.00   0.0
1E 1740.7-2942        265.985  -29.711 2.1  359.148   -0.092    4.1  0.32  12.7    2.9  0.26  11.0
SAX J1750.8-2900      267.582  -29.038 2.1    0.445   -0.935    3.5  0.28  12.8    1.2  0.22   5.3
XTE J1810-189         272.586  -19.095 2.5   11.339   +0.048    5.9  0.55  10.7    3.0  0.42   7.1
GX 9+1                270.335  -20.527 2.4    9.056   +1.195    5.7  0.51  11.1    0.0  0.00   0.0
IGR J17354-3255       263.867  -32.935 3.0  355.456   -0.276    3.0  0.34   8.7    0.0  0.00   0.0
GX 1+4                262.981  -24.746 3.8    1.923   +4.816    2.4  0.36   6.6    0.0  0.00   0.0
SLX 1744-299_300      266.902  -29.967 4.1  359.344   -0.905    1.9  0.31   6.2    0.0  0.00   0.0
XTE J1709-267         257.449  -26.688 4.7  357.484   +7.840    3.1  0.00   5.3    0.0  0.00   0.0
SGR J1745-29          266.478  -28.994 4.7  359.984   -0.085    1.5  0.29   5.3    0.0  0.00   0.0
GX 17+2               273.988  -13.985 4.4   16.469   +1.318   16.0  2.84   5.6    0.0  0.00   0.0
1A 1742-294           266.448  -29.527 0.0  359.516   -0.340    1.5  0.00   4.9    0.0  0.00   0.0
IGR J17254-3257       261.233  -32.975 0.0  354.205   +1.546    2.1  0.00   4.9    0.0  0.00   0.0
SLX 1735-269          264.545  -26.999 4.8    0.779   +2.417    1.9  0.37   5.1    1.3  0.28   4.7
4U 1735-444           264.750  -44.524 5.8  345.993   -7.037   20.9  4.97   4.2    0.0  0.00   0.0
IGR J17473-2721       266.845  -27.391 0.0    1.522   +0.471    1.5  0.00   4.3    0.0  0.00   0.0
JEM-X
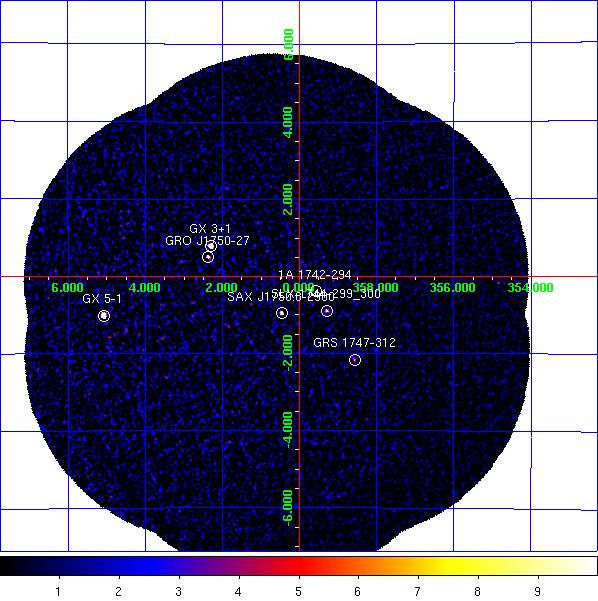
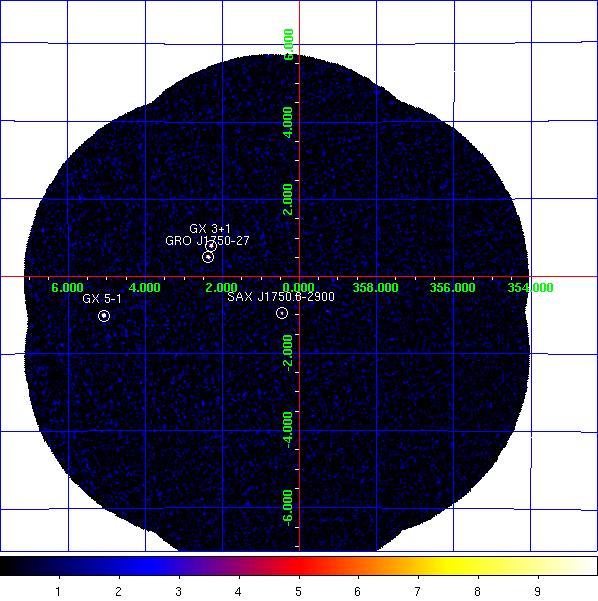
JEM-X1 significance mosaic images. Left: 3-10 keV. Right: 10-25 keV.
Sources labelled were detected in the 3-10 keV image > 6σ. The sources detected above 3σ in the 3-10 keV and/or 10-25 keV band are listed in the table below. Fluxes are extracted at the known catalogue position of the source (i.e. no fitting of the source position is done), with
mosaic_spec, in two bands: A = 3-10 keV (1 Crab ~ 97 cps [J1], 103 cps [J2]); B = 10-25 keV (1 Crab ~ 29 cps [J1], 27 cps [J2]). NOTES: The object marked as SLX 1744-299_300 is used to indicate two low-mass x-ray binaries separated by 2.7 arcminutes, SLX 1744-299 and SLX 1744-300; the position for SLX 1744-299 is used, although it can not be ruled out that SLX 1744-300 may dominate the emission some of the time. The systematic noise increases towards the edge of the field of view and in the vicinity of very bright sources, such as GX 5-1;
NEW SOURCEs < 6σ towards the border of the image and/or near GX 5-1 may, therefore, be spurious.
JEM-X1 Detected Sources in 3-10 keV (A) and 10-25 keV (B).
Source Name             RA       dec      l        b     A(cps)  +/-   sig  B(cps)  +/-   sig
==================== ========  ======= ======== ======== ====== ===== ===== ====== ===== =====
1A 1742-294           266.523  -29.515  359.559   -0.389    2.0  0.29   6.9    0.5  0.18   2.6
1E 1740.7-2942        265.978  -29.745  359.116   -0.106    1.3  0.32   4.2    0.6  0.20   2.9
1E 1743.1-2843        266.587  -28.729    0.260   -0.029    1.1  0.31   3.5    0.4  0.19   1.9
GRO J1750-27          267.307  -26.654    2.366   +0.499    8.3  0.44  19.0    7.0  0.26  26.5
GRS 1741.9-2853       266.260  -28.914  359.953   +0.120    1.4  0.31   4.6    0.3  0.19   1.3
GRS 1747-312          267.690  -31.292  358.555   -2.168    2.2  0.32   6.8    0.0  0.00   0.0
GRS 1758-258          270.303  -25.741    4.511   -1.361    3.0  0.79   3.8    0.5  0.46   1.1
GX 3+1                266.988  -26.559    2.299   +0.793   48.7  0.51  96.4    5.9  0.27  21.8
GX 5-1                270.280  -25.077    5.077   -1.014  124.4  1.36  91.4   18.4  0.70  26.1
MXB 1730-335          263.350  -33.388  354.841   -0.158    4.1  1.17   3.5    1.9  1.00   1.9
SAX J1750.8-2900      267.608  -29.032    0.462   -0.951    5.8  0.29  19.8    1.4  0.18   7.8
SLX 1744-299_300      266.858  -29.999  359.297   -0.889    3.4  0.30  11.4    0.5  0.19   2.7
NEW SOURCE            270.003  -26.697    3.547   -1.601    2.5  0.54   4.7    0.3  0.32   1.0
NEW SOURCE            270.946  -27.283    3.451   -2.621    2.6  0.57   4.5    0.0  0.00   0.0
NEW SOURCE            269.305  -24.409    5.215   +0.086    5.7  1.27   4.5    0.0  0.00   0.0
NEW SOURCE            268.742  -28.018    1.842   -1.293    1.5  0.35   4.2    0.0  0.00   0.0
NEW SOURCE            271.587  -24.503    6.160   -1.766    2.9  2.22   1.3    4.0  1.33   3.0
NEW SOURCE            269.056  -22.614    6.653   +1.185   14.3  4.05   3.5    8.2  2.83   2.9