INTEGRAL Galactic bulge Monitoring
Revolution 0657: Observation start 2008-02-29T13:05 = MJD 54525.546
Total Observation GTI = 10024 seconds
IBIS/ISGRI
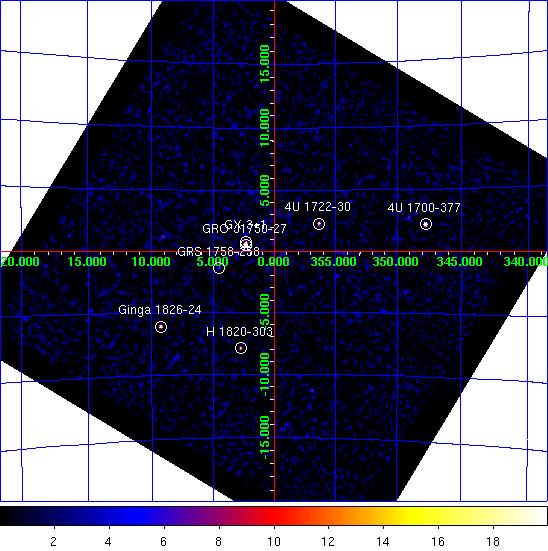
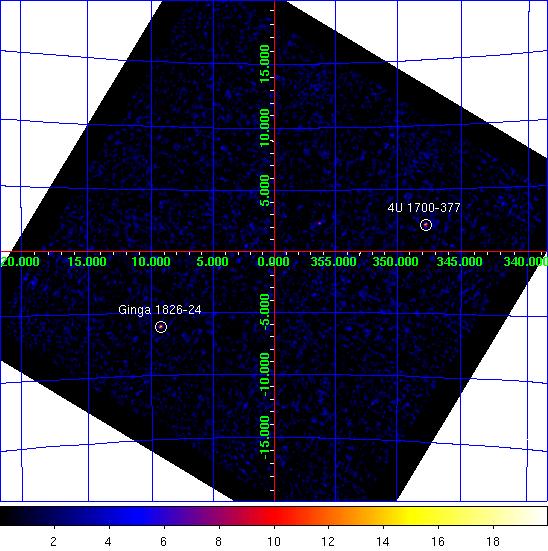
IBIS/ISGRI significance mosaic images. Left: IBIS/ISGRI 18-40 keV. Right: 40-100 keV
Sources detected > 10σ in each band are marked on the image. The table below lists the fitted position, and statistical positional uncertainty in arcmin returned by the mosaic step of
OSA10.1, of all the sources detected in the 18 - 40 keV range (band A: 1 Crab ~ 208 cps ) and 40 - 100 keV range (band B: 1 Crab ~ 100 cps ) where available.NOTES: The table is constructed from the
isgri_mosa_res.fits file - fluxes in the mosaic output are known to be systematically ~10% lower than in the ScW light-curves (see known issues). The systematic noise increases towards the edge of the field of view and NEW SOURCEs < 6σ towards the border of the image may be spurious. IBIS/ISGRI Detected Sources 18-40 keV (A) and 40-100 keV (B)
Source Name             RA       dec   +/-    l        b     A(cps)  +/-   sig  B(cps)  +/-   sig
==================== ========  ======= === ======== ======== ====== ===== ===== ====== ===== =====
GRO J1750-27          267.298  -26.647 0.4    2.368   +0.510   42.6  0.39 109.7    1.9  0.32   6.1
4U 1700-377           255.984  -37.838 0.9  347.758   +2.179   32.0  0.85  37.8    9.5  0.64  15.0
Ginga 1826-24         277.358  -23.788 1.0    9.277   -6.076   19.2  0.65  29.6    7.9  0.49  16.3
4U 1722-30            261.886  -30.808 1.3  356.314   +2.296    9.4  0.41  22.7    3.1  0.32   9.7
H 1820-303            275.911  -30.367 1.5    2.780   -7.911   10.9  0.57  19.1    0.0  0.00   0.0
GX 3+1                266.972  -26.543 0.0    2.306   +0.813    5.1  0.00  12.9    0.0  0.00   0.0
GX 9+1                270.357  -20.525 3.0    9.067   +1.178    4.8  0.56   8.7    0.0  0.00   0.0
1E 1740.7-2942        265.958  -29.726 3.3  359.123   -0.081    2.9  0.36   7.9    2.5  0.31   8.0
GRS 1758-258          270.307  -25.720 2.6    4.531   -1.354    4.2  0.42  10.1    2.6  0.33   7.8
GX 349+2              256.428  -36.454 3.1  349.076   +2.734    6.2  0.74   8.5    0.0  0.00   0.0
GX 354-0              263.009  -33.756 3.5  354.377   -0.120    3.2  0.44   7.3    0.0  0.00   0.0
3A 1822-371           276.487  -37.072 3.3  356.896  -11.307    5.7  0.73   7.9    0.0  0.00   0.0
SLX 1735-269          264.534  -26.976 4.1    0.794   +2.438    2.5  0.40   6.2    0.0  0.00   0.0
GX 17+2               274.002  -14.069 3.9   16.401   +1.265   24.7  3.86   6.4    0.0  0.00   0.0
SLX 1744-299_300      266.792  -30.076 5.4  359.201   -0.880    1.6  0.36   4.6    0.0  0.00   0.0
1A 1742-294           266.496  -29.584 0.0  359.488   -0.405    2.0  0.00   5.8    0.0  0.00   0.0
GX 1+4                262.987  -24.735 5.0    1.935   +4.818    2.4  0.49   5.0    0.0  0.00   0.0
MXB 1730-335          263.234  -33.386 0.0  354.789   -0.076    2.3  0.00   5.3    0.0  0.00   0.0
GX 5-1                270.305  -25.119 5.0    5.052   -1.054    2.1  0.43   4.9    0.0  0.00   0.0
IGR J17404-3655       265.126  -36.929 5.9  352.630   -3.283    2.3  0.00   4.2    0.0  0.00   0.0
SLX 1737-282          265.288  -28.340 6.0  359.993   +1.147    1.5  0.00   4.1    0.0  0.00   0.0
IGR J17252-3616       261.238  -36.312 5.4  351.446   -0.331    2.5  0.54   4.6    0.0  0.00   0.0
MAXI J1659-152        254.718  -15.228 6.7    5.518  +16.574   14.5  4.05   3.6    0.0  0.00   0.0
H 1702-429            256.569  -43.089 5.2  343.847   -1.353   10.2  2.16   4.7    0.0  0.00   0.0
1E 1742.8-2853        266.597  -29.000 7.4    0.033   -0.176    1.1  0.35   3.2    0.0  0.00   0.0
IGR J17375-3022       264.397  -30.299 5.9  357.921   +0.762    1.5  0.36   4.1    0.0  0.00   0.0
JEM-X
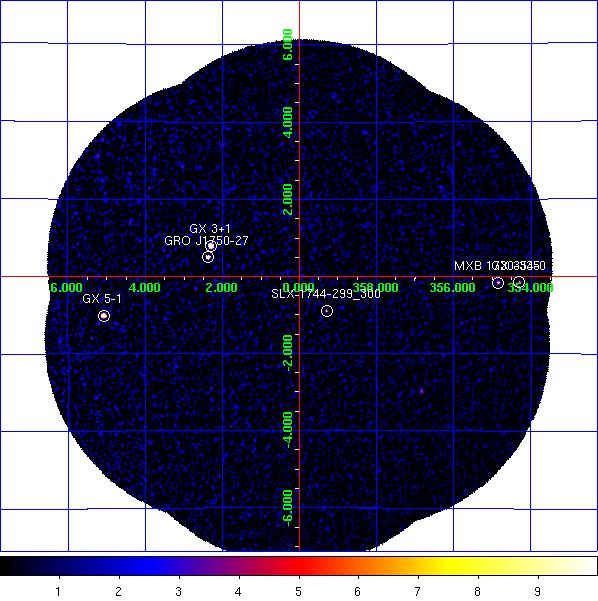
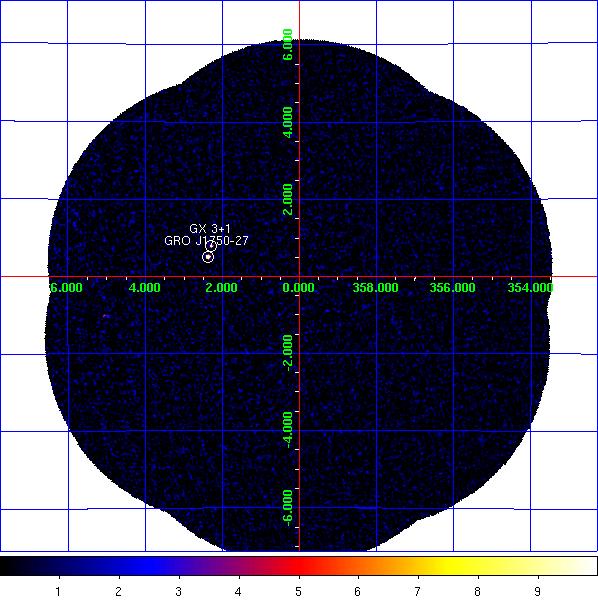
JEM-X1 significance mosaic images. Left: 3-10 keV. Right: 10-25 keV.
Sources labelled were detected in the 3-10 keV image > 6σ. The sources detected above 3σ in the 3-10 keV and/or 10-25 keV band are listed in the table below. Fluxes are extracted at the known catalogue position of the source (i.e. no fitting of the source position is done), with
mosaic_spec, in two bands: A = 3-10 keV (1 Crab ~ 97 cps [J1], 103 cps [J2]); B = 10-25 keV (1 Crab ~ 29 cps [J1], 27 cps [J2]). NOTES: The object marked as SLX 1744-299_300 is used to indicate two low-mass x-ray binaries separated by 2.7 arcminutes, SLX 1744-299 and SLX 1744-300; the position for SLX 1744-299 is used, although it can not be ruled out that SLX 1744-300 may dominate the emission some of the time. The systematic noise increases towards the edge of the field of view and in the vicinity of very bright sources, such as GX 5-1;
NEW SOURCEs < 6σ towards the border of the image and/or near GX 5-1 may, therefore, be spurious.
JEM-X1 Detected Sources in 3-10 keV (A) and 10-25 keV (B).
Source Name             RA       dec      l        b     A(cps)  +/-   sig  B(cps)  +/-   sig
==================== ========  ======= ======== ======== ====== ===== ===== ====== ===== =====
1A 1742-294           266.523  -29.515  359.559   -0.389    1.8  0.38   4.7    0.5  0.23   2.1
4U 1722-30            261.888  -30.802  356.320   +2.298    2.9  0.77   3.8    1.3  0.57   2.3
GRO J1750-27          267.319  -26.642    2.382   +0.496   17.3  0.66  26.1   10.7  0.38  28.4
GX 3+1                266.984  -26.561    2.296   +0.794   44.4  0.71  62.8    4.6  0.36  12.8
GX 354-0              262.989  -33.835  354.302   -0.150    8.9  1.39   6.4    1.2  1.04   1.2
GX 5-1                270.282  -25.080    5.075   -1.018   87.1  2.24  38.8    4.6  1.02   4.5
MXB 1730-335          263.350  -33.388  354.841   -0.158   10.7  1.12   9.6    0.8  0.73   1.1
SLX 1737-282          265.163  -28.297  359.971   +1.264    1.3  0.43   3.1    0.3  0.26   1.2
SLX 1744-299_300      266.858  -29.999  359.297   -0.889    2.5  0.37   6.7    0.5  0.23   2.2
SLX 1746-331          267.467  -33.195  356.822   -2.979    3.4  0.60   5.7    0.0  0.00   0.0
NEW SOURCE            266.475  -22.851    5.232   +3.111   18.6  4.15   4.5    4.4  2.81   1.6
NEW SOURCE            264.343  -25.450    1.994   +3.398    4.7  1.10   4.2    0.0  0.00   0.0
NEW SOURCE            268.279  -26.783    2.699   -0.313    2.4  0.63   3.8    0.4  0.35   1.3
NEW SOURCE            265.462  -24.852    3.040   +2.856    4.4  1.16   3.8    0.0  0.00   0.0
NEW SOURCE            266.415  -23.798    4.393   +2.667    7.0  1.97   3.6    0.0  0.00   0.0