INTEGRAL Galactic bulge Monitoring
Revolution 0655: Observation start 2008-02-23T11:25 = MJD 54519.476
Total Observation GTI = 10595 seconds
IBIS/ISGRI
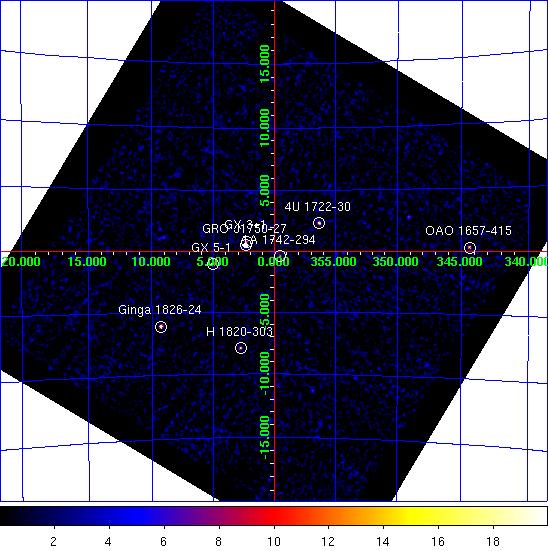

IBIS/ISGRI significance mosaic images. Left: IBIS/ISGRI 18-40 keV. Right: 40-100 keV
Sources detected > 10σ in each band are marked on the image. The table below lists the fitted position, and statistical positional uncertainty in arcmin returned by the mosaic step of
OSA10.1, of all the sources detected in the 18 - 40 keV range (band A: 1 Crab ~ 208 cps ) and 40 - 100 keV range (band B: 1 Crab ~ 100 cps ) where available.NOTES: The table is constructed from the
isgri_mosa_res.fits file - fluxes in the mosaic output are known to be systematically ~10% lower than in the ScW light-curves (see known issues). The systematic noise increases towards the edge of the field of view and NEW SOURCEs < 6σ towards the border of the image may be spurious. IBIS/ISGRI Detected Sources 18-40 keV (A) and 40-100 keV (B)
Source Name             RA       dec   +/-    l        b     A(cps)  +/-   sig  B(cps)  +/-   sig
==================== ========  ======= === ======== ======== ====== ===== ===== ====== ===== =====
GRO J1750-27          267.302  -26.643 0.4    2.373   +0.508   43.9  0.41 107.2    2.2  0.35   6.3
GX 5-1                270.290  -25.083 0.8    5.077   -1.025   16.7  0.43  39.0    0.0  0.00   0.0
Ginga 1826-24         277.360  -23.803 1.2    9.264   -6.085   17.8  0.68  26.3    6.7  0.51  13.2
4U 1722-30            261.874  -30.792 1.3  356.321   +2.313   10.4  0.46  22.5    5.1  0.35  14.5
OAO 1657-415          255.214  -41.654 1.7  344.376   +0.314   29.0  1.71  17.0    8.8  1.27   6.9
H 1820-303            275.912  -30.351 1.6    2.795   -7.904    9.3  0.53  17.7    0.0  0.00   0.0
1A 1742-294           266.526  -29.532 2.0  359.546   -0.401    4.8  0.35  13.5    0.0  0.00   0.0
GX 3+1                266.944  -26.575 0.0    2.266   +0.818    4.6  0.00  11.3    0.0  0.00   0.0
GRS 1758-258          270.321  -25.728 0.0    4.530   -1.369    4.1  0.00   9.5    2.2  0.34   6.5
GX 349+2              256.410  -36.422 2.8  349.092   +2.766    7.9  0.85   9.3    0.0  0.00   0.0
SGR J1745-29          266.475  -28.992 4.0  359.984   -0.081    2.3  0.37   6.2    0.0  0.00   0.0
3A 1822-371           276.448  -37.098 3.9  356.858  -11.290    4.6  0.70   6.6    0.0  0.00   0.0
GX 9+1                270.425  -20.524 3.2    9.100   +1.124    4.7  0.59   8.0    0.0  0.00   0.0
GX 354-0              262.994  -33.790 3.6  354.342   -0.129    3.1  0.44   7.1    0.0  0.00   0.0
IGR J17252-3616       261.384  -36.247 4.8  351.566   -0.392    2.9  0.56   5.2    0.0  0.00   0.0
MXB 1730-335          263.453  -33.363 4.7  354.909   -0.217    2.3  0.44   5.3    0.0  0.00   0.0
GX 13+1               273.649  -17.213 4.7   13.475   +0.065    5.2  1.00   5.3    0.0  0.00   0.0
SLX 1744-299_300      266.831  -29.946 0.0  359.330   -0.842    1.8  0.00   4.9    0.0  0.00   0.0
GX 1+4                263.035  -24.724 5.3    1.968   +4.787    2.1  0.45   4.6    0.0  0.00   0.0
1E 1740.7-2942        265.949  -29.721 5.4  359.123   -0.072    1.6  0.35   4.6    1.3  0.29   4.4
IGR J17254-3257       261.247  -32.994 6.2  354.196   +1.526    1.8  0.00   3.9    1.3  0.37   3.4
IGR J18027-2016       270.699  -20.197 0.0    9.511   +1.061    2.3  0.00   3.8    0.0  0.00   0.0
JEM-X
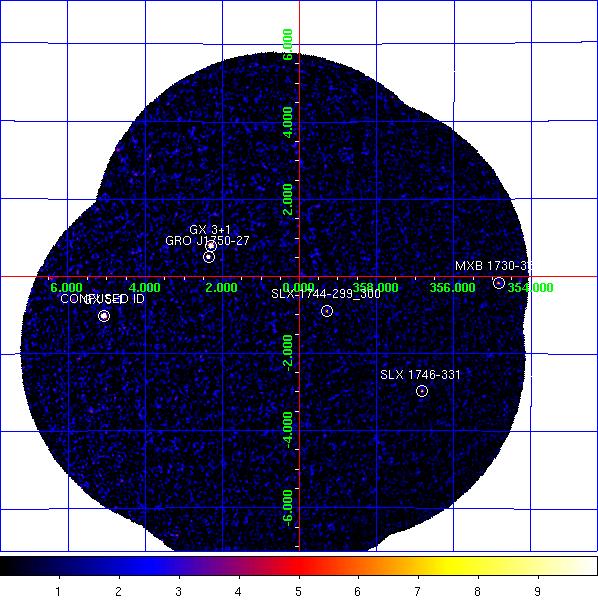
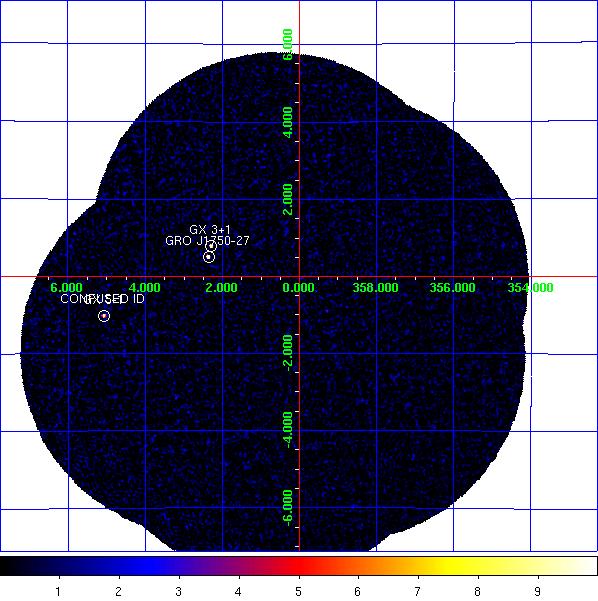
JEM-X1 significance mosaic images. Left: 3-10 keV. Right: 10-25 keV.
Sources labelled were detected in the 3-10 keV image > 6σ. The sources detected above 3σ in the 3-10 keV and/or 10-25 keV band are listed in the table below. Fluxes are extracted at the known catalogue position of the source (i.e. no fitting of the source position is done), with
mosaic_spec, in two bands: A = 3-10 keV (1 Crab ~ 97 cps [J1], 103 cps [J2]); B = 10-25 keV (1 Crab ~ 29 cps [J1], 27 cps [J2]). NOTES: The object marked as SLX 1744-299_300 is used to indicate two low-mass x-ray binaries separated by 2.7 arcminutes, SLX 1744-299 and SLX 1744-300; the position for SLX 1744-299 is used, although it can not be ruled out that SLX 1744-300 may dominate the emission some of the time. The systematic noise increases towards the edge of the field of view and in the vicinity of very bright sources, such as GX 5-1;
NEW SOURCEs < 6σ towards the border of the image and/or near GX 5-1 may, therefore, be spurious.
JEM-X1 Detected Sources in 3-10 keV (A) and 10-25 keV (B).
Source Name             RA       dec      l        b     A(cps)  +/-   sig  B(cps)  +/-   sig
==================== ========  ======= ======== ======== ====== ===== ===== ====== ===== =====
4U 1722-30            261.888  -30.802  356.320   +2.298    3.8  1.24   3.0    0.0  0.00   0.0
CONFUSED ID           270.284  -25.079    5.077   -1.019   97.0  1.68  57.6   13.8  0.84  16.4
GRO J1750-27          267.299  -26.654    2.362   +0.506   17.6  0.65  26.9   10.6  0.38  27.8
GX 3+1                266.989  -26.563    2.297   +0.790   44.7  0.70  63.8    5.8  0.36  16.1
GX 354-0              262.989  -33.835  354.302   -0.150   14.5  3.09   4.7    2.7  2.21   1.2
GX 5-1                270.286  -25.090    5.068   -1.026   91.2  1.64  55.6   13.5  0.83  16.2
MXB 1730-335          263.350  -33.388  354.841   -0.158   11.6  1.59   7.3    2.1  1.18   1.8
SLX 1744-299_300      266.858  -29.999  359.297   -0.889    2.6  0.38   6.9    0.6  0.23   2.8
SLX 1746-331          267.453  -33.206  356.806   -2.974    4.5  0.62   7.3    0.0  0.00   0.0
NEW SOURCE            270.109  -23.418    6.441   -0.056   18.7  3.28   5.7    3.0  2.22   1.3
NEW SOURCE            272.846  -25.980    5.417   -3.476    9.4  1.78   5.3    1.1  0.93   1.2
NEW SOURCE            266.356  -23.937    4.246   +2.641   10.1  2.07   4.9    0.0  0.00   0.0
NEW SOURCE            270.309  -24.207    5.846   -0.606   10.2  2.29   4.5    0.0  0.00   0.0
NEW SOURCE            271.323  -27.752    3.205   -3.142    2.4  0.68   3.6    1.2  0.40   3.0