INTEGRAL Galactic bulge Monitoring
Revolution 0610: Observation start 2007-10-11T23:10 = MJD 54384.966
Total Observation GTI = 12099 seconds
IBIS/ISGRI
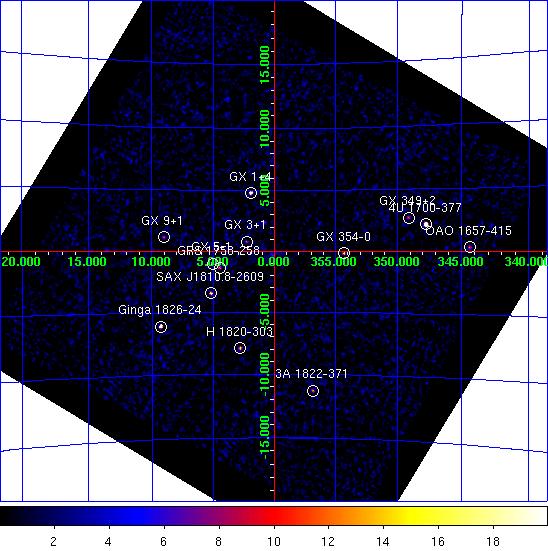
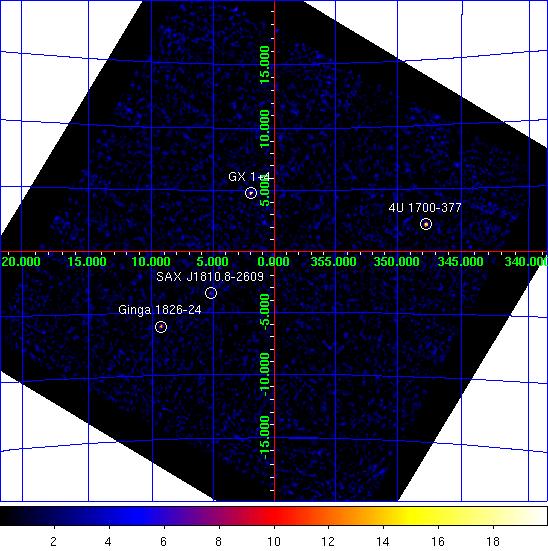
IBIS/ISGRI significance mosaic images. Left: IBIS/ISGRI 18-40 keV. Right: 40-100 keV
Sources detected > 10σ in each band are marked on the image. The table below lists the fitted position, and statistical positional uncertainty in arcmin returned by the mosaic step of
OSA10.1, of all the sources detected in the 18 - 40 keV range (band A: 1 Crab ~ 208 cps ) and 40 - 100 keV range (band B: 1 Crab ~ 100 cps ) where available.NOTES: The table is constructed from the
isgri_mosa_res.fits file - fluxes in the mosaic output are known to be systematically ~10% lower than in the ScW light-curves (see known issues). The systematic noise increases towards the edge of the field of view and NEW SOURCEs < 6σ towards the border of the image may be spurious. IBIS/ISGRI Detected Sources 18-40 keV (A) and 40-100 keV (B)
Source Name             RA       dec   +/-    l        b     A(cps)  +/-   sig  B(cps)  +/-   sig
==================== ========  ======= === ======== ======== ====== ===== ===== ====== ===== =====
4U 1700-377           255.990  -37.847 0.6  347.754   +2.169   50.0  0.81  61.4   14.2  0.62  22.8
GX 1+4                263.005  -24.748 0.8    1.933   +4.796   16.2  0.40  40.3    0.0  0.00   0.0
Ginga 1826-24         277.368  -23.789 0.9    9.279   -6.084   20.4  0.58  35.2    7.5  0.45  16.6
SAX J1810.8-2609      272.695  -26.151 1.3    5.200   -3.439    9.2  0.40  23.0    3.4  0.33  10.3
GX 5-1                270.285  -25.089 1.3    5.070   -1.024    7.9  0.36  22.1    0.0  0.00   0.0
H 1820-303            275.924  -30.339 1.7    2.810   -7.908    7.9  0.46  17.1    0.0  0.00   0.0
GX 354-0              262.986  -33.841 1.6  354.295   -0.151    6.5  0.37  17.6    1.4  0.30   4.6
OAO 1657-415          255.203  -41.655 2.0  344.369   +0.320   32.0  2.37  13.5   11.4  1.74   6.6
GRS 1758-258          270.266  -25.738 2.0    4.496   -1.330    4.8  0.34  13.8    2.3  0.28   8.1
3A 1822-371           276.433  -37.122 1.9  356.831  -11.290    9.4  0.66  14.3    0.0  0.00   0.0
GX 349+2              256.460  -36.415 2.1  349.122   +2.737    8.8  0.68  13.0    0.0  0.00   0.0
GX 3+1                266.975  -26.565 2.2    2.288   +0.799    4.1  0.34  12.1    0.0  0.00   0.0
GX 9+1                270.359  -20.557 2.2    9.041   +1.161    5.7  0.47  12.1    0.0  0.00   0.0
SLX 1744-299_300      266.871  -29.991 2.9  359.309   -0.894    2.8  0.32   8.8    1.5  0.27   5.7
SLX 1735-269          264.614  -26.970 3.2    0.837   +2.381    2.9  0.36   8.1    1.9  0.30   6.2
GX 13+1               273.667  -17.116 3.9   13.569   +0.096    5.2  0.80   6.5    0.0  0.00   0.0
4U 1722-30            261.857  -30.830 4.2  356.281   +2.305    2.4  0.39   6.0    0.0  0.00   0.0
1A 1743-288           266.750  -28.963 3.7    0.134   -0.272    2.1  0.31   6.9    1.3  0.26   4.9
IGR J18173-2509       274.409  -25.238 5.3    6.741   -4.366    1.9  0.00   4.7    0.0  0.00   0.0
GX 17+2               274.001  -14.069 6.3   16.401   +1.267   10.5  2.74   3.8    0.0  0.00   0.0
QSO B1730-130         263.157  -13.091 5.7   11.969  +10.893   11.0  2.54   4.3    0.0  0.00   0.0
Swift J174535.5-2901  266.329  -29.035 0.0  359.881   +0.006    1.4  0.00   4.2    0.0  0.00   0.0
IGR J17091-3624       257.278  -36.496 7.3  349.451   +2.162    2.1  0.63   3.3    0.0  0.00   0.0
1RXS J175721.2-30440  269.330  -30.790 6.6  359.699   -3.127    1.3  0.36   3.6    0.0  0.00   0.0
JEM-X

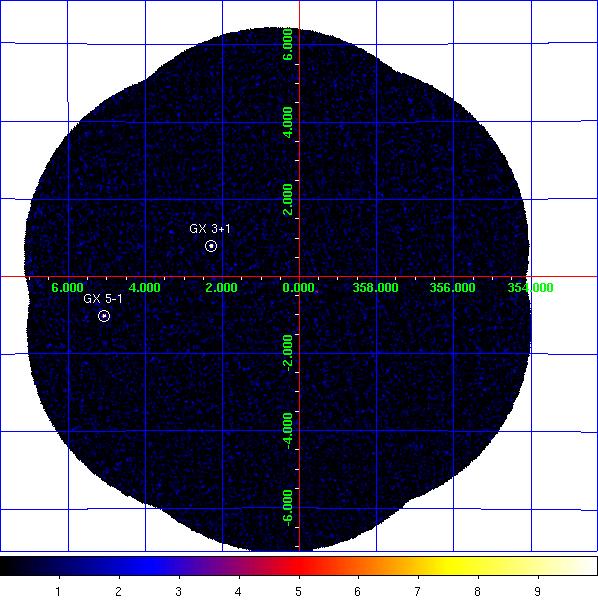
JEM-X1 significance mosaic images. Left: 3-10 keV. Right: 10-25 keV.
Sources labelled were detected in the 3-10 keV image > 6σ. The sources detected above 3σ in the 3-10 keV and/or 10-25 keV band are listed in the table below. Fluxes are extracted at the known catalogue position of the source (i.e. no fitting of the source position is done), with
mosaic_spec, in two bands: A = 3-10 keV (1 Crab ~ 97 cps [J1], 103 cps [J2]); B = 10-25 keV (1 Crab ~ 29 cps [J1], 27 cps [J2]). NOTES: The object marked as SLX 1744-299_300 is used to indicate two low-mass x-ray binaries separated by 2.7 arcminutes, SLX 1744-299 and SLX 1744-300; the position for SLX 1744-299 is used, although it can not be ruled out that SLX 1744-300 may dominate the emission some of the time. The systematic noise increases towards the edge of the field of view and in the vicinity of very bright sources, such as GX 5-1;
NEW SOURCEs < 6σ towards the border of the image and/or near GX 5-1 may, therefore, be spurious.
JEM-X1 Detected Sources in 3-10 keV (A) and 10-25 keV (B).
Source Name             RA       dec      l        b     A(cps)  +/-   sig  B(cps)  +/-   sig
==================== ========  ======= ======== ======== ====== ===== ===== ====== ===== =====
1A 1742-294           266.523  -29.515  359.559   -0.389    4.9  0.38  13.1    0.8  0.21   4.1
1E 1743.1-2843        266.587  -28.729    0.260   -0.029    1.2  0.38   3.2    0.0  0.00   0.0
GRS 1741.9-2853       266.260  -28.914  359.953   +0.120    1.2  0.39   3.1    0.0  0.00   0.0
GX 3+1                266.983  -26.566    2.291   +0.793   46.8  0.57  81.5    5.3  0.27  19.6
GX 354-0              262.989  -33.835  354.302   -0.150   15.6  2.15   7.3    3.4  1.60   2.1
GX 5-1                270.281  -25.082    5.073   -1.018  103.3  1.50  68.8    9.0  0.63  14.1
SLX 1735-269          264.571  -26.994    0.796   +2.400    2.4  0.50   4.9    0.5  0.27   2.0
SLX 1744-299_300      266.858  -29.999  359.297   -0.889    1.4  0.36   3.8    0.2  0.20   1.1
SLX 1746-331          267.453  -33.209  356.804   -2.976    7.5  0.75  10.0    0.0  0.00   0.0
Swift J174535.5-2901  266.398  -29.026  359.920   -0.042    1.2  0.36   3.4    0.0  0.00   0.0
NEW SOURCE            267.946  -24.740    4.305   +0.985    4.2  0.94   4.5    0.0  0.00   0.0
NEW SOURCE            267.340  -25.104    3.711   +1.271    3.6  0.79   4.6    0.0  0.00   0.0