INTEGRAL Galactic bulge Monitoring
Revolution 0603: Observation start 2007-09-21T04:10 = MJD 54364.174
Total Observation GTI = 11856 seconds
IBIS/ISGRI
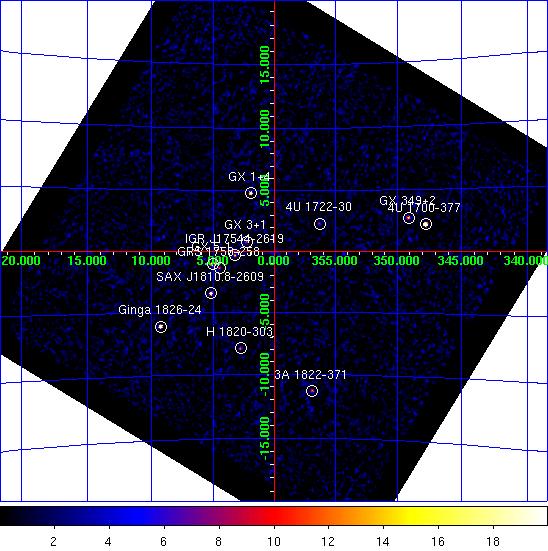
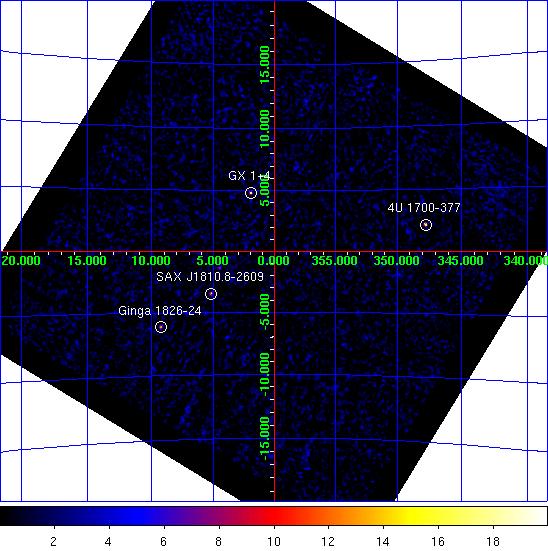
IBIS/ISGRI significance mosaic images. Left: IBIS/ISGRI 18-40 keV. Right: 40-100 keV
Sources detected > 10σ in each band are marked on the image. The table below lists the fitted position, and statistical positional uncertainty in arcmin returned by the mosaic step of
OSA10.1, of all the sources detected in the 18 - 40 keV range (band A: 1 Crab ~ 208 cps ) and 40 - 100 keV range (band B: 1 Crab ~ 100 cps ) where available.NOTES: The table is constructed from the
isgri_mosa_res.fits file - fluxes in the mosaic output are known to be systematically ~10% lower than in the ScW light-curves (see known issues). The systematic noise increases towards the edge of the field of view and NEW SOURCEs < 6σ towards the border of the image may be spurious. IBIS/ISGRI Detected Sources 18-40 keV (A) and 40-100 keV (B)
Source Name             RA       dec   +/-    l        b     A(cps)  +/-   sig  B(cps)  +/-   sig
==================== ========  ======= === ======== ======== ====== ===== ===== ====== ===== =====
4U 1700-377           255.984  -37.850 0.6  347.749   +2.171   47.5  0.79  60.2   13.3  0.60  22.2
GX 5-1                270.285  -25.082 0.7    5.075   -1.020   17.7  0.36  49.5    0.0  0.00   0.0
SAX J1810.8-2609      272.688  -26.151 0.9    5.198   -3.434   13.7  0.40  34.0    5.3  0.32  16.8
GX 1+4                263.011  -24.741 0.9    1.942   +4.796   13.6  0.39  35.3    0.0  0.00   0.0
Ginga 1826-24         277.361  -23.793 1.0    9.273   -6.081   19.8  0.61  32.8    7.1  0.47  15.1
GX 349+2              256.448  -36.429 1.6  349.105   +2.737   11.9  0.68  17.5    0.0  0.00   0.0
IGR J17544-2619       268.594  -26.324 1.8    3.237   -0.323    5.3  0.34  15.7    0.0  0.00   0.0
3A 1822-371           276.489  -37.082 2.0  356.887  -11.313    9.8  0.74  13.3    0.0  0.00   0.0
GRS 1758-258          270.317  -25.746 0.0    4.513   -1.374    4.2  0.00  12.2    2.6  0.27   9.3
H 1820-303            275.923  -30.356 2.0    2.795   -7.915    7.4  0.55  13.6    0.0  0.00   0.0
GX 3+1                266.986  -26.564 2.4    2.294   +0.791    3.8  0.34  11.4    0.0  0.00   0.0
4U 1722-30            261.888  -30.823 2.5  356.302   +2.287    4.3  0.40  10.7    1.4  0.32   4.4
GX 9+1                270.345  -20.543 3.6    9.046   +1.179    3.6  0.52   7.1    0.0  0.00   0.0
GX 354-0              263.058  -33.847 3.9  354.323   -0.205    2.8  0.42   6.5    0.0  0.00   0.0
SLX 1735-269          264.574  -26.981 3.6    0.808   +2.405    2.8  0.40   7.1    0.0  0.00   0.0
1E 1743.1-2843        266.587  -28.757 0.0    0.236   -0.043    1.7  0.00   5.4    0.0  0.00   0.0
SAX J1712.6-3739      258.106  -37.580 4.6  348.970   +0.988    3.2  0.60   5.4    0.0  0.00   0.0
SLX 1744-299_300      266.774  -29.947 5.3  359.303   -0.800    1.6  0.35   4.6    0.0  0.00   0.0
GX 17+2               274.024  -14.027 5.0   16.449   +1.266   16.8  3.37   5.0    0.0  0.00   0.0
GX 13+1               273.708  -17.112 5.9   13.592   +0.064    4.2  1.01   4.1    0.0  0.00   0.0
IGR J18027-2016       270.732  -20.240 5.5    9.489   +1.013    2.4  0.53   4.4    0.0  0.00   0.0
1A 1742-294           266.569  -29.553 4.6  359.548   -0.443    1.7  0.32   5.4    0.0  0.00   0.0
Swift J174535.5-2901  266.399  -29.087 0.0  359.869   -0.074    1.3  0.00   4.2    0.0  0.00   0.0
XB 1832-330           278.870  -32.916 6.0    1.578  -11.291    2.8  0.70   4.0    0.0  0.00   0.0
IGR J17407-2808       265.277  -28.180 5.7    0.123   +1.240    1.4  0.33   4.3    0.0  0.00   0.0
H 1702-429            256.620  -43.045 5.4  343.904   -1.356   13.1  2.90   4.5    0.0  0.00   0.0
GRS 1747-312          267.766  -31.205 5.9  358.663   -2.180    1.5  0.36   4.2    0.0  0.00   0.0
JEM-X
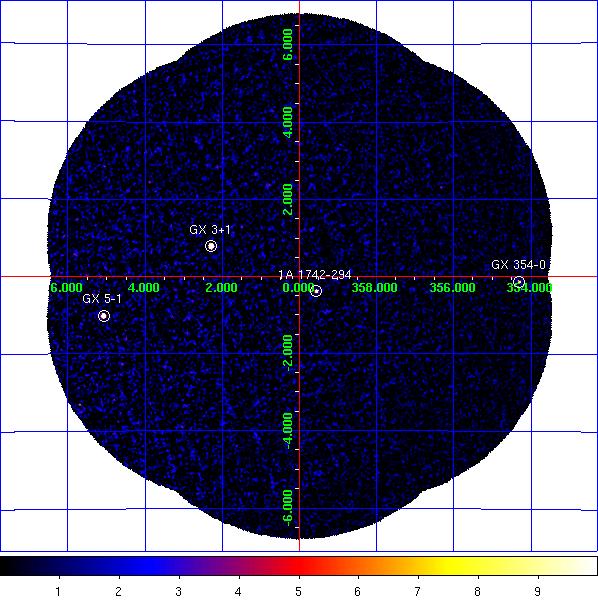
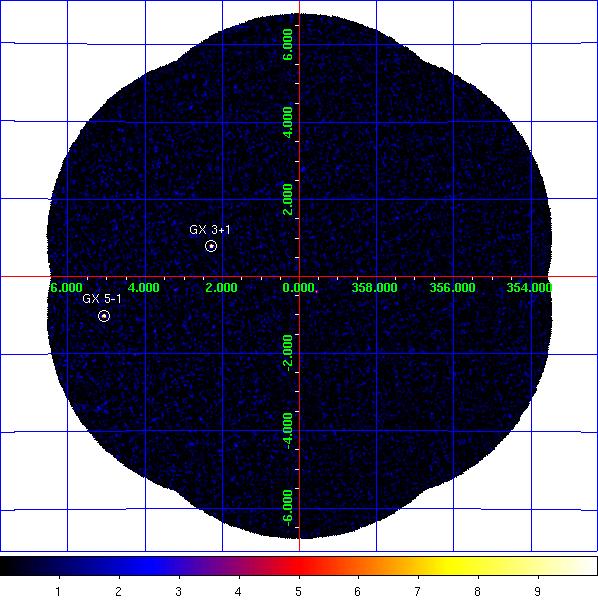
JEM-X1 significance mosaic images. Left: 3-10 keV. Right: 10-25 keV.
Sources labelled were detected in the 3-10 keV image > 6σ. The sources detected above 3σ in the 3-10 keV and/or 10-25 keV band are listed in the table below. Fluxes are extracted at the known catalogue position of the source (i.e. no fitting of the source position is done), with
mosaic_spec, in two bands: A = 3-10 keV (1 Crab ~ 97 cps [J1], 103 cps [J2]); B = 10-25 keV (1 Crab ~ 29 cps [J1], 27 cps [J2]). NOTES: The object marked as SLX 1744-299_300 is used to indicate two low-mass x-ray binaries separated by 2.7 arcminutes, SLX 1744-299 and SLX 1744-300; the position for SLX 1744-299 is used, although it can not be ruled out that SLX 1744-300 may dominate the emission some of the time. The systematic noise increases towards the edge of the field of view and in the vicinity of very bright sources, such as GX 5-1;
NEW SOURCEs < 6σ towards the border of the image and/or near GX 5-1 may, therefore, be spurious.
JEM-X1 Detected Sources in 3-10 keV (A) and 10-25 keV (B).
Source Name             RA       dec      l        b     A(cps)  +/-   sig  B(cps)  +/-   sig
==================== ========  ======= ======== ======== ====== ===== ===== ====== ===== =====
1A 1742-294           266.523  -29.515  359.559   -0.389    5.7  0.31  18.1    1.0  0.18   5.2
4U 1722-30            261.888  -30.802  356.320   +2.298    2.0  0.65   3.1    0.8  0.49   1.6
GX 3+1                266.981  -26.569    2.288   +0.792   46.1  0.53  87.3    4.9  0.26  18.8
GX 354-0              262.977  -33.820  354.308   -0.134   11.9  1.25   9.5    2.0  1.00   2.0
GX 5-1                270.287  -25.081    5.077   -1.021  109.9  1.94  56.7   18.7  0.96  19.5
SLX 1735-269          264.571  -26.994    0.796   +2.400    1.5  0.42   3.6    0.0  0.00   0.0
SLX 1744-299_300      266.858  -29.999  359.297   -0.889    1.0  0.31   3.2    0.0  0.00   0.0
NEW SOURCE            269.162  -23.657    5.800   +0.577   10.9  2.15   5.1    1.9  1.19   1.6
NEW SOURCE            269.354  -24.507    5.153   -0.001    6.3  1.51   4.2    1.6  0.82   1.9
NEW SOURCE            264.950  -25.626    2.137   +2.840    2.6  0.61   4.3    0.6  0.35   1.6
NEW SOURCE            271.236  -26.109    4.603   -2.272    5.8  1.37   4.2    0.0  0.00   0.0
NEW SOURCE            272.837  -25.669    5.686   -3.320   18.2  4.27   4.3    0.0  0.00   0.0
NEW SOURCE            264.530  -26.571    1.135   +2.657    2.0  0.47   4.2    0.0  0.00   0.0
IGR J17544-2619       268.599  -26.355    3.212   -0.343    1.6  0.58   2.8    1.0  0.31   3.3