INTEGRAL Galactic bulge Monitoring
Revolution 0593: Observation start 2007-08-22T02:53 = MJD 54334.121
Total Observation GTI = 12377 seconds
IBIS/ISGRI
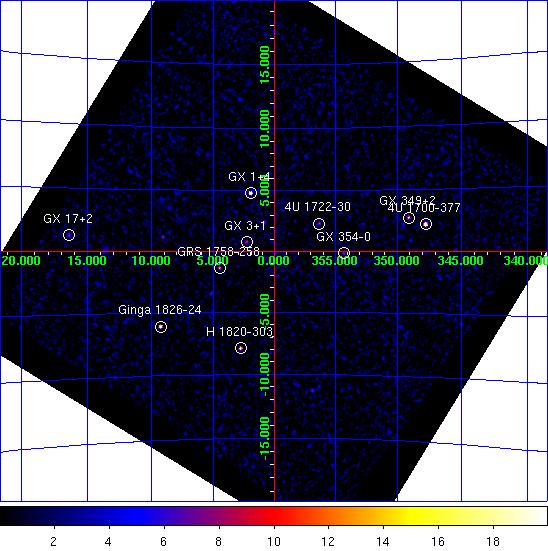
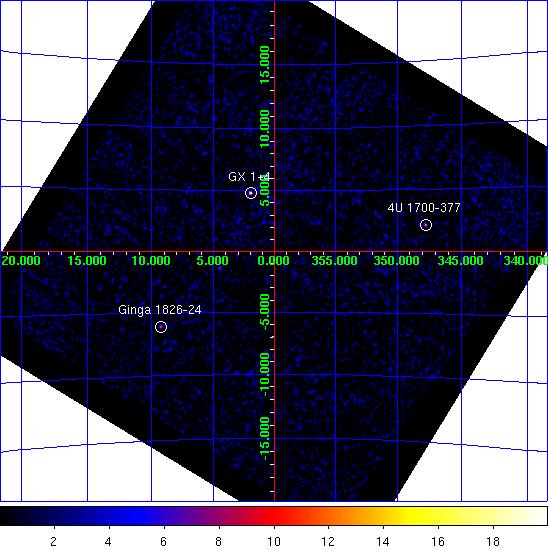
IBIS/ISGRI significance mosaic images. Left: IBIS/ISGRI 18-40 keV. Right: 40-100 keV
Sources detected > 10σ in each band are marked on the image. The table below lists the fitted position, and statistical positional uncertainty in arcmin returned by the mosaic step of
OSA10.1, of all the sources detected in the 18 - 40 keV range (band A: 1 Crab ~ 208 cps ) and 40 - 100 keV range (band B: 1 Crab ~ 100 cps ) where available.NOTES: The table is constructed from the
isgri_mosa_res.fits file - fluxes in the mosaic output are known to be systematically ~10% lower than in the ScW light-curves (see known issues). The systematic noise increases towards the edge of the field of view and NEW SOURCEs < 6σ towards the border of the image may be spurious. IBIS/ISGRI Detected Sources 18-40 keV (A) and 40-100 keV (B)
Source Name             RA       dec   +/-    l        b     A(cps)  +/-   sig  B(cps)  +/-   sig
==================== ========  ======= === ======== ======== ====== ===== ===== ====== ===== =====
4U 1700-377           255.974  -37.848 0.8  347.745   +2.179   28.8  0.71  40.4    8.0  0.55  14.5
GX 1+4                263.007  -24.739 0.9    1.942   +4.800   13.1  0.34  38.1    0.0  0.00   0.0
Ginga 1826-24         277.370  -23.795 1.1    9.275   -6.089   17.2  0.64  26.9    6.2  0.49  12.6
H 1820-303            275.918  -30.365 1.3    2.784   -7.915   10.5  0.48  22.1    0.0  0.00   0.0
GX 349+2              256.429  -36.441 1.6  349.087   +2.742   11.6  0.65  17.9    0.0  0.00   0.0
GRS 1758-258          270.305  -25.742 1.8    4.510   -1.363    5.6  0.36  15.7    2.6  0.30   8.8
4U 1722-30            261.913  -30.797 2.3  356.336   +2.283    4.4  0.38  11.4    0.0  0.00   0.0
GX 3+1                266.995  -26.573 2.4    2.291   +0.780    3.5  0.32  11.2    0.0  0.00   0.0
GX 5-1                270.294  -25.092 0.0    5.071   -1.032    3.4  0.00   9.5    0.0  0.00   0.0
GX 17+2               274.001  -14.039 2.6   16.427   +1.281   27.5  2.68  10.3    0.0  0.00   0.0
GX 354-0              262.992  -33.848 2.5  354.292   -0.159    3.7  0.35  10.6    0.0  0.00   0.0
GX 9+1                270.380  -20.504 2.8    9.096   +1.170    4.2  0.45   9.4    0.0  0.00   0.0
SAX J1810.8-2609      272.678  -26.178 3.1    5.170   -3.439    3.3  0.39   8.5    0.0  0.00   0.0
SLX 1735-269          264.572  -26.977 3.1    0.811   +2.409    2.9  0.35   8.2    1.5  0.29   5.0
3A 1822-371           276.439  -37.090 3.3  356.862  -11.280    5.3  0.68   7.9    0.0  0.00   0.0
IGR J17091-3624       257.345  -36.452 4.3  349.519   +2.145    3.6  0.62   5.8    0.0  0.00   0.0
Swift J174535.5-2901  266.422  -29.050 4.5  359.911   -0.072    1.7  0.30   5.6    0.0  0.00   0.0
GX 13+1               273.700  -17.106 4.3   13.593   +0.073    4.4  0.00   5.8    0.0  0.00   0.0
H 1702-429            256.511  -43.000 4.2  343.892   -1.266   12.4  2.07   6.0    7.5  1.55   4.8
SLX 1744-299_300      266.826  -30.110 5.6  359.187   -0.922    1.4  0.32   4.4    0.0  0.00   0.0
SAX J1712.6-3739      258.183  -37.684 4.6  348.920   +0.877    3.4  0.62   5.5    0.0  0.00   0.0
AX J1736.4-2910       264.250  -29.209 5.2  358.773   +1.455    1.5  0.31   4.7    0.0  0.00   0.0
IGR J17252-3616       261.281  -36.226 6.3  351.536   -0.311    1.8  0.48   3.8    0.0  0.00   0.0
PKS 1830-211          278.333  -21.133 4.8   12.066   -5.675    4.2  0.82   5.1    0.0  0.00   0.0
XTE J1720-318         259.879  -31.786 6.3  354.537   +3.162    1.5  0.39   3.9    0.0  0.00   0.0
1RXS J165443.5-19162  262.535  -19.375 5.7    6.245   +8.067    2.4  0.56   4.3    0.0  0.00   0.0
IGR J17511-3057       267.837  -30.888 6.6  358.967   -2.070    1.3  0.00   3.7    0.0  0.00   0.0
4U 1705-32            257.313  -32.292 0.0  352.856   +4.637    1.7  0.00   3.6    0.0  0.00   0.0
SAX J1750.8-2900      267.623  -28.999 6.8    0.497   -0.945    1.1  0.00   3.5    0.0  0.00   0.0
1A 1742-294           266.494  -29.498 0.0  359.561   -0.359    1.0  0.00   3.5    0.0  0.00   0.0
IGR J17451-3022       266.400  -30.403 0.0  358.746   -0.760    1.1  0.00   3.4    0.0  0.00   0.0
MXB 1730-335          263.341  -33.439 6.3  354.794   -0.179    1.3  0.34   3.9    0.0  0.00   0.0
JEM-X
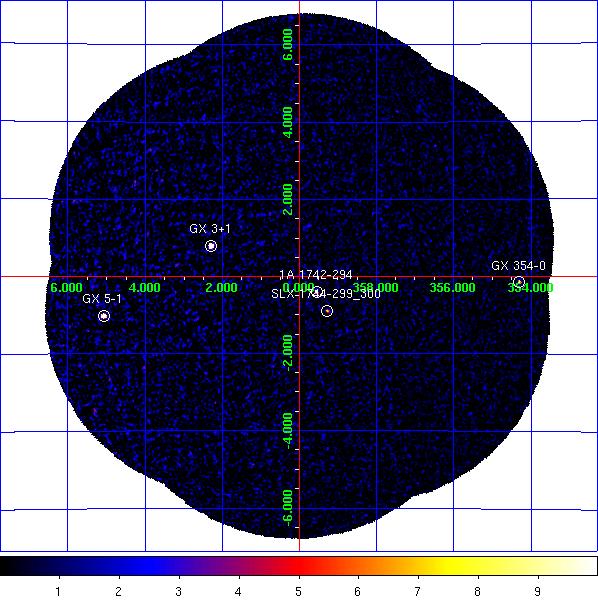
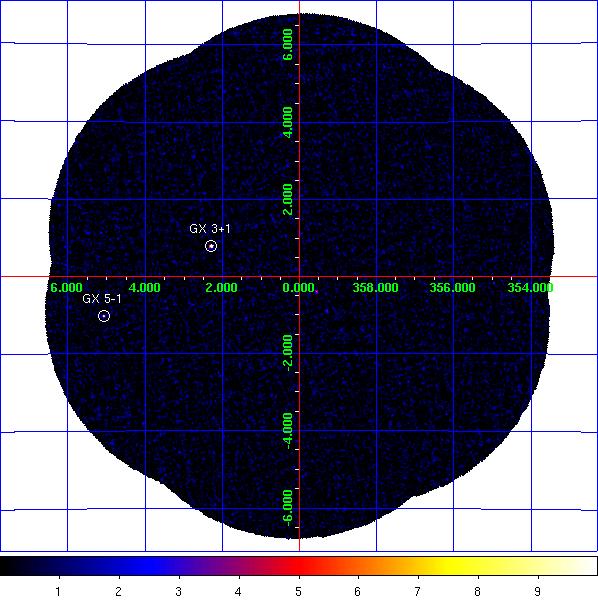
JEM-X1 significance mosaic images. Left: 3-10 keV. Right: 10-25 keV.
Sources labelled were detected in the 3-10 keV image > 6σ. The sources detected above 3σ in the 3-10 keV and/or 10-25 keV band are listed in the table below. Fluxes are extracted at the known catalogue position of the source (i.e. no fitting of the source position is done), with
mosaic_spec, in two bands: A = 3-10 keV (1 Crab ~ 97 cps [J1], 103 cps [J2]); B = 10-25 keV (1 Crab ~ 29 cps [J1], 27 cps [J2]). NOTES: The object marked as SLX 1744-299_300 is used to indicate two low-mass x-ray binaries separated by 2.7 arcminutes, SLX 1744-299 and SLX 1744-300; the position for SLX 1744-299 is used, although it can not be ruled out that SLX 1744-300 may dominate the emission some of the time. The systematic noise increases towards the edge of the field of view and in the vicinity of very bright sources, such as GX 5-1;
NEW SOURCEs < 6σ towards the border of the image and/or near GX 5-1 may, therefore, be spurious.
JEM-X1 Detected Sources in 3-10 keV (A) and 10-25 keV (B).
Source Name             RA       dec      l        b     A(cps)  +/-   sig  B(cps)  +/-   sig
==================== ========  ======= ======== ======== ====== ===== ===== ====== ===== =====
1A 1742-294           266.523  -29.525  359.551   -0.394    5.2  0.32  16.4    1.0  0.19   5.2
1E 1743.1-2843        266.587  -28.729    0.260   -0.029    1.2  0.33   3.8    0.0  0.00   0.0
GX 3+1                266.980  -26.569    2.287   +0.793   39.7  0.51  77.4    4.5  0.25  17.9
GX 354-0              262.989  -33.835  354.302   -0.150   15.7  1.36  11.5    1.9  1.03   1.9
GX 5-1                270.284  -25.080    5.076   -1.018   92.0  1.79  51.4    5.3  0.74   7.2
SLX 1744-299_300      266.858  -29.999  359.297   -0.889    2.2  0.32   6.9    0.6  0.19   3.0
NEW SOURCE            267.894  -22.932    5.835   +1.948   14.1  2.92   4.8    0.0  0.00   0.0
NEW SOURCE            266.546  -24.016    4.269   +2.451    4.5  1.05   4.3    0.0  0.00   0.0
NEW SOURCE            272.775  -26.080    5.298   -3.468   15.7  3.30   4.8    0.0  0.00   0.0
NEW SOURCE            265.555  -23.917    3.880   +3.275    5.1  1.13   4.5    0.0  0.00   0.0
NEW SOURCE            271.792  -26.025    4.920   -2.668    8.7  2.21   4.0    0.0  0.00   0.0
NEW SOURCE            271.012  -26.648    4.034   -2.362    3.8  0.93   4.1    0.0  0.00   0.0
NEW SOURCE            267.981  -26.054    3.190   +0.288    2.5  0.60   4.2    0.0  0.00   0.0
NEW SOURCE            269.460  -23.986    5.652   +0.175    7.6  1.89   4.0    0.0  0.00   0.0