INTEGRAL Galactic bulge Monitoring
Revolution 0489: Observation start 2006-10-17T02:50 = MJD 54025.118
Total Observation GTI = 12102 seconds
IBIS/ISGRI
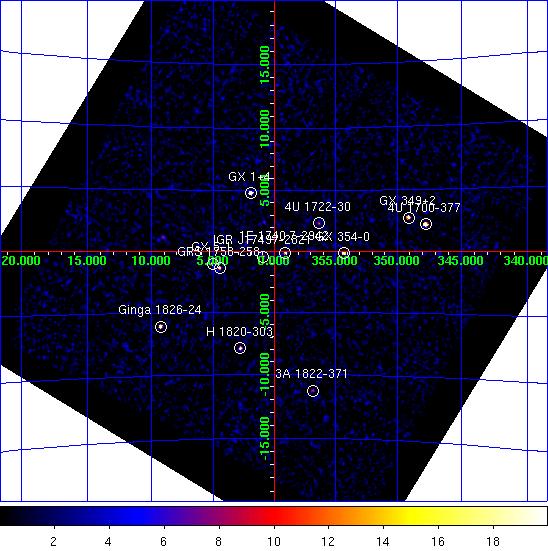
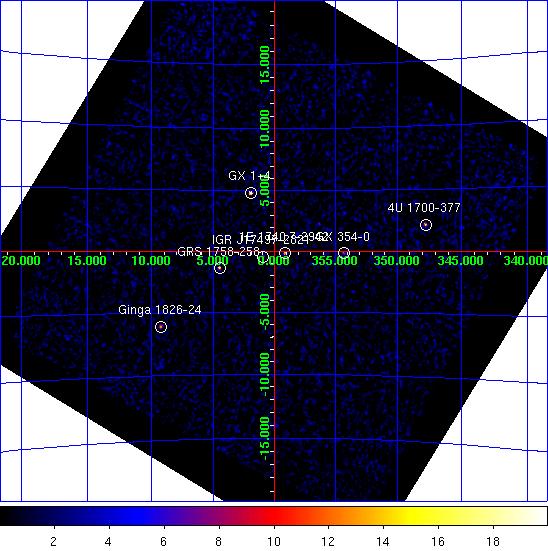
IBIS/ISGRI significance mosaic images. Left: IBIS/ISGRI 18-40 keV. Right: 40-100 keV
Sources detected > 10σ in each band are marked on the image. The table below lists the fitted position, and statistical positional uncertainty in arcmin returned by the mosaic step of
OSA10.1, of all the sources detected in the 18 - 40 keV range (band A: 1 Crab ~ 208 cps ) and 40 - 100 keV range (band B: 1 Crab ~ 100 cps ) where available.NOTES: The table is constructed from the
isgri_mosa_res.fits file - fluxes in the mosaic output are known to be systematically ~10% lower than in the ScW light-curves (see known issues). The systematic noise increases towards the edge of the field of view and NEW SOURCEs < 6σ towards the border of the image may be spurious. IBIS/ISGRI Detected Sources 18-40 keV (A) and 40-100 keV (B)
Source Name             RA       dec   +/-    l        b     A(cps)  +/-   sig  B(cps)  +/-   sig
==================== ========  ======= === ======== ======== ====== ===== ===== ====== ===== =====
GX 1+4                263.007  -24.744 0.6    1.937   +4.798   25.5  0.39  65.8    0.0  0.00   0.0
4U 1700-377           255.986  -37.850 0.7  347.749   +2.171   35.5  0.69  51.8    9.0  0.52  17.5
GX 354-0              262.994  -33.834 0.8  354.304   -0.153   16.2  0.40  40.7    3.9  0.32  12.4
GX 5-1                270.283  -25.070 0.9    5.085   -1.013   14.3  0.39  36.3    0.0  0.00   0.0
GX 349+2              256.443  -36.427 1.0  349.104   +2.741   19.0  0.61  31.3    0.0  0.00   0.0
Ginga 1826-24         277.366  -23.795 1.1    9.273   -6.085   17.1  0.59  29.0    7.0  0.45  15.5
GRS 1758-258          270.311  -25.741 1.3    4.514   -1.367    7.8  0.33  23.4    5.6  0.27  20.7
1E 1740.7-2942        265.973  -29.754 1.3  359.105   -0.106    7.7  0.32  23.7    4.8  0.26  18.2
H 1820-303            275.929  -30.356 1.2    2.797   -7.919   11.6  0.49  23.8    0.0  0.00   0.0
IGR J17497-2821       267.389  -28.354 1.5    0.945   -0.438    6.6  0.35  18.7    3.9  0.29  13.5
4U 1722-30            261.883  -30.785 2.3  356.331   +2.311    3.9  0.34  11.5    2.1  0.27   7.7
3A 1822-371           276.438  -37.110 2.2  356.844  -11.288    8.3  0.66  12.5    0.0  0.00   0.0
GX 3+1                266.987  -26.587 2.7    2.275   +0.779    3.0  0.31   9.7    0.0  0.00   0.0
1A 1742-294           266.494  -29.502 0.0  359.557   -0.361    3.3  0.00   9.3    0.0  0.00   0.0
GX 9+1                270.399  -20.558 3.0    9.058   +1.128    4.6  0.52   8.8    0.0  0.00   0.0
GX 13+1               273.647  -17.179 4.2   13.505   +0.083    5.0  0.83   6.0    0.0  0.00   0.0
SLX 1735-269          264.577  -26.956 3.7    0.831   +2.417    2.4  0.35   6.9    1.3  0.29   4.4
SLX 1744-299_300      266.970  -29.995 4.6  359.350   -0.970    1.7  0.00   5.4    0.0  0.00   0.0
OAO 1657-415          255.211  -41.647 4.4  344.380   +0.321    9.6  1.68   5.7    0.0  0.00   0.0
IGR J18027-2016       270.731  -20.298 0.0    9.438   +0.986    2.6  0.00   5.2    0.0  0.00   0.0
IGR J16500-3307       252.455  -33.144 5.5  349.661   +7.345    3.3  0.00   4.5    0.0  0.00   0.0
GRO J1750-27          267.320  -26.621 0.0    2.400   +0.507    1.3  0.00   4.2    0.0  0.00   0.0
V2400 Oph             258.153  -24.266 6.0  359.850   +8.727    2.0  0.48   4.1    0.0  0.00   0.0
Swift J175648.6-2544  269.165  -25.684 6.4    4.049   -0.444    1.2  0.32   3.8    0.0  0.00   0.0
IGR J17195-4100       259.965  -40.918 6.7  347.087   -2.122    3.3  0.90   3.6    0.0  0.00   0.0
GX 17+2               273.970  -14.007 5.4   16.441   +1.322   17.1  3.77   4.5    0.0  0.00   0.0
Oph Cluster           258.062  -23.290 6.3    0.611   +9.356    1.9  0.00   3.9    1.2  0.36   3.3
IGR J16482-3036       252.040  -30.595 7.0  351.429   +9.231    3.0  0.88   3.4    0.0  0.00   0.0
1E 1743.1-2843        266.494  -28.762 0.0    0.189   +0.024    1.1  0.00   3.6    0.0  0.00   0.0
IGR J17451-3022       266.400  -30.325 6.8  358.812   -0.720    1.1  0.00   3.5    0.0  0.00   0.0
3A 1728-169           262.955  -16.898 6.9    8.578   +9.055    2.8  0.00   3.5    0.0  0.00   0.0
H 1702-429            256.538  -43.001 7.3  343.903   -1.282    7.6  2.31   3.3    0.0  0.00   0.0
IGR J17204-3554       260.163  -35.887 7.1  351.305   +0.626    1.6  0.00   3.4    0.0  0.00   0.0
Swift J181539.7-1833  273.968  -18.597 7.1   12.404   -0.862    2.4  0.00   3.4    0.0  0.00   0.0
XB 1832-330           278.910  -33.056 7.2    1.463  -11.382    2.1  0.00   3.3    0.0  0.00   0.0
IGR J17404-3655       265.074  -37.011 7.4  352.538   -3.291    1.5  0.00   3.2    0.0  0.00   0.0
JEM-X
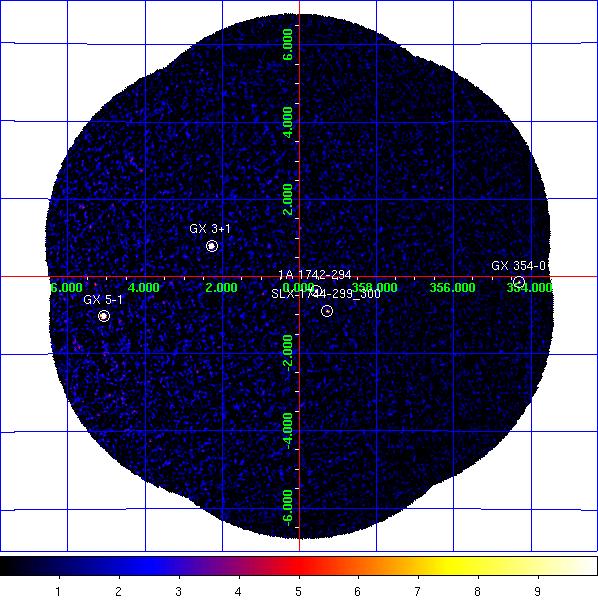
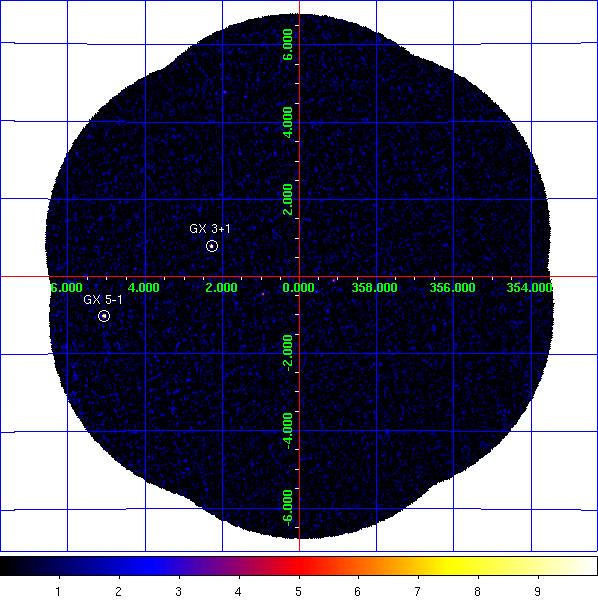
JEM-X1 significance mosaic images. Left: 3-10 keV. Right: 10-25 keV.
Sources labelled were detected in the 3-10 keV image > 6σ. The sources detected above 3σ in the 3-10 keV and/or 10-25 keV band are listed in the table below. Fluxes are extracted at the known catalogue position of the source (i.e. no fitting of the source position is done), with
mosaic_spec, in two bands: A = 3-10 keV (1 Crab ~ 97 cps [J1], 103 cps [J2]); B = 10-25 keV (1 Crab ~ 29 cps [J1], 27 cps [J2]). NOTES: The object marked as SLX 1744-299_300 is used to indicate two low-mass x-ray binaries separated by 2.7 arcminutes, SLX 1744-299 and SLX 1744-300; the position for SLX 1744-299 is used, although it can not be ruled out that SLX 1744-300 may dominate the emission some of the time. The systematic noise increases towards the edge of the field of view and in the vicinity of very bright sources, such as GX 5-1;
NEW SOURCEs < 6σ towards the border of the image and/or near GX 5-1 may, therefore, be spurious.
JEM-X1 Detected Sources in 3-10 keV (A) and 10-25 keV (B).
Source Name             RA       dec      l        b     A(cps)  +/-   sig  B(cps)  +/-   sig
==================== ========  ======= ======== ======== ====== ===== ===== ====== ===== =====
1A 1742-294           266.523  -29.515  359.559   -0.389    2.6  0.28   9.1    0.6  0.17   3.5
1E 1740.7-2942        265.978  -29.745  359.116   -0.106    0.6  0.28   2.2    0.9  0.18   5.0
1E 1743.1-2843        266.587  -28.729    0.260   -0.029    1.0  0.29   3.5    0.3  0.17   1.7
4U 1722-30            261.888  -30.802  356.320   +2.298    2.0  0.59   3.4    0.6  0.42   1.5
GX 1+4                263.009  -24.746    1.937   +4.795    1.5  1.07   1.4    2.6  0.72   3.6
GX 3+1                266.975  -26.575    2.280   +0.794   34.1  0.47  72.2    4.0  0.24  16.9
GX 354-0              262.989  -33.835  354.302   -0.150    9.5  1.15   8.3    4.3  0.97   4.4
GX 5-1                270.284  -25.097    5.062   -1.027  114.2  1.83  62.3   17.6  0.85  20.6
SLX 1737-282          265.163  -28.297  359.971   +1.264    1.3  0.30   4.3    0.3  0.18   1.8
SLX 1744-299_300      266.858  -29.999  359.297   -0.889    1.9  0.28   6.9    0.4  0.17   2.2
NEW SOURCE            271.213  -25.592    5.044   -2.002    9.2  1.70   5.4    0.0  0.00   0.0
NEW SOURCE            267.914  -23.184    5.629   +1.804   12.7  2.42   5.2    0.0  0.00   0.0
NEW SOURCE            269.624  -24.496    5.285   -0.209    7.4  1.54   4.8    1.6  0.84   1.9
IGR J17497-2821       267.414  -28.358    0.953   -0.459    1.1  0.32   3.6    0.9  0.18   5.1