INTEGRAL Galactic bulge Monitoring
Revolution 0418: Observation start 2006-03-16T18:38 = MJD 53810.777
Total Observation GTI = 12034 seconds
IBIS/ISGRI
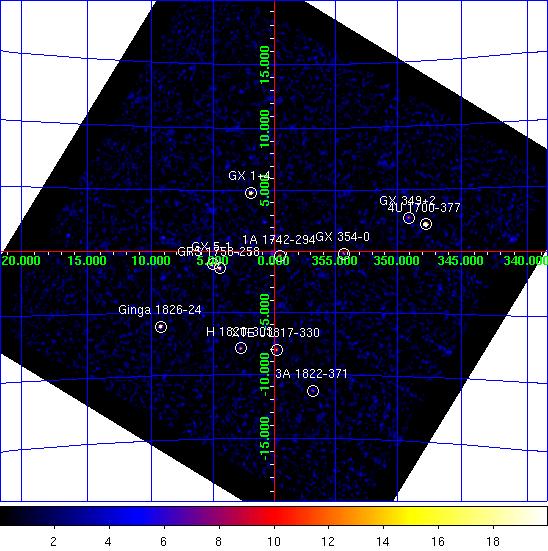
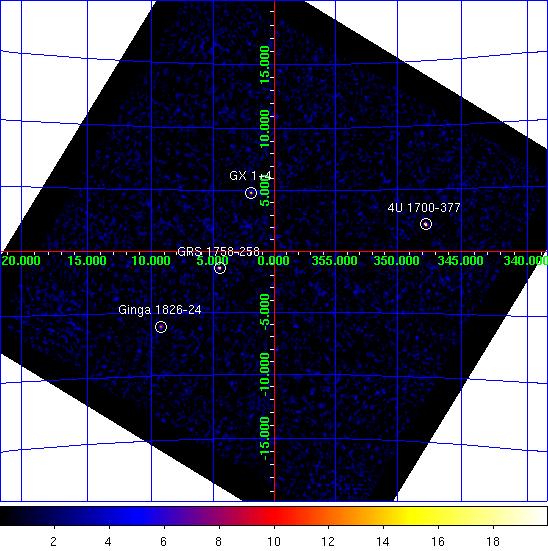
IBIS/ISGRI significance mosaic images. Left: IBIS/ISGRI 18-40 keV. Right: 40-100 keV
Sources detected > 10σ in each band are marked on the image. The table below lists the fitted position, and statistical positional uncertainty in arcmin returned by the mosaic step of
OSA10.1, of all the sources detected in the 18 - 40 keV range (band A: 1 Crab ~ 208 cps ) and 40 - 100 keV range (band B: 1 Crab ~ 100 cps ) where available.NOTES: The table is constructed from the
isgri_mosa_res.fits file - fluxes in the mosaic output are known to be systematically ~10% lower than in the ScW light-curves (see known issues). The systematic noise increases towards the edge of the field of view and NEW SOURCEs < 6σ towards the border of the image may be spurious. IBIS/ISGRI Detected Sources 18-40 keV (A) and 40-100 keV (B)
Source Name             RA       dec   +/-    l        b     A(cps)  +/-   sig  B(cps)  +/-   sig
==================== ========  ======= === ======== ======== ====== ===== ===== ====== ===== =====
GX 5-1                270.288  -25.081 0.6    5.077   -1.023   20.0  0.33  60.6    0.0  0.00   0.0
4U 1700-377           255.988  -37.848 0.6  347.752   +2.170   47.9  0.79  60.7   14.7  0.60  24.6
GX 1+4                263.002  -24.742 0.9    1.937   +4.803   12.8  0.35  36.7    0.0  0.00   0.0
GRS 1758-258          270.305  -25.738 1.0    4.514   -1.361    9.7  0.33  29.5    6.6  0.26  25.2
Ginga 1826-24         277.366  -23.787 1.1    9.281   -6.082   17.4  0.60  28.9    6.2  0.46  13.6
1A 1742-294           266.512  -29.522 1.4  359.548   -0.385    6.2  0.30  20.9    1.9  0.24   8.0
XTE J1817-330         274.469  -33.025 1.9  359.826   -8.027    6.5  0.44  14.9    2.7  0.33   8.0
H 1820-303            275.924  -30.357 1.9    2.794   -7.916    7.6  0.52  14.6    0.0  0.00   0.0
GX 349+2              256.441  -36.434 2.2  349.097   +2.738    7.5  0.62  12.2    0.0  0.00   0.0
GX 354-0              263.011  -33.836 1.9  354.311   -0.166    5.7  0.40  14.5    0.0  0.00   0.0
3A 1822-371           276.427  -37.117 2.5  356.833  -11.283    7.5  0.70  10.7    0.0  0.00   0.0
1A 1743-288           266.666  -28.853 2.9    0.190   -0.152    2.6  0.29   9.1    0.0  0.00   0.0
GX 3+1                266.976  -26.567 2.9    2.288   +0.797    3.0  0.33   9.1    0.0  0.00   0.0
GX 9+1                270.437  -20.542 3.7    9.090   +1.105    3.5  0.51   6.8    0.0  0.00   0.0
GX 17+2               274.041  -13.989 3.5   16.490   +1.270   21.0  2.85   7.4    0.0  0.00   0.0
SLX 1744-299_300      266.872  -30.025 3.7  359.281   -0.912    2.3  0.33   6.8    0.0  0.00   0.0
SLX 1735-269          264.579  -26.954 4.0    0.833   +2.416    2.3  0.37   6.3    0.0  0.00   0.0
SLX 1737-282          265.127  -28.376 3.9  359.887   +1.249    2.0  0.30   6.5    0.0  0.00   0.0
3A 1728-169           262.953  -16.966 4.7    8.519   +9.020    4.0  0.76   5.2    0.0  0.00   0.0
OAO 1657-415          255.185  -41.634 4.3  344.378   +0.344    8.4  1.45   5.8    0.0  0.00   0.0
IGR J17353-3539       263.687  -35.693 0.0  353.055   -1.643    1.7  0.00   4.6    0.0  0.00   0.0
1RXS J163759.7-26062  249.562  -26.100 6.2  353.541  +13.778    8.7  2.25   3.9    0.0  0.00   0.0
Swift J175759.9-2246  269.497  -22.861 5.6    6.643   +0.709    1.7  0.40   4.4    0.0  0.00   0.0
1A 1744-361           267.148  -36.079 7.4  354.204   -4.230    1.3  0.39   3.2    0.0  0.00   0.0
4U 1722-30            261.809  -30.738 5.7  356.335   +2.390    1.6  0.37   4.3    0.0  0.00   0.0
GRS 1747-312          267.750  -31.304 0.0  358.571   -2.218    1.3  0.00   3.8    0.0  0.00   0.0
XB 1832-330           278.932  -32.904 6.5    1.612  -11.334    2.4  0.65   3.7    0.0  0.00   0.0
IGR J17488-3253       267.169  -32.995 6.6  356.866   -2.662    1.2  0.34   3.7    0.0  0.00   0.0
JEM-X
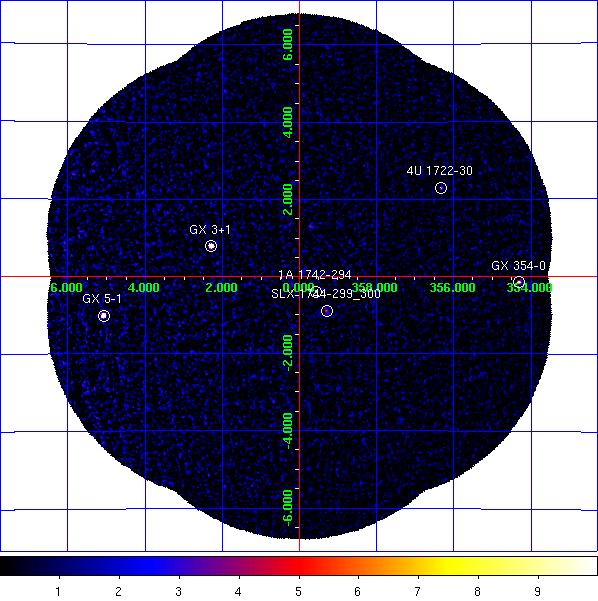
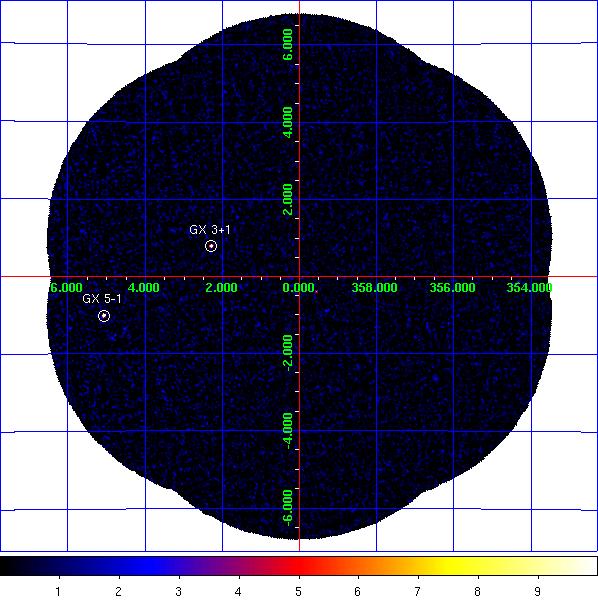
JEM-X1 significance mosaic images. Left: 3-10 keV. Right: 10-25 keV.
Sources labelled were detected in the 3-10 keV image > 6σ. The sources detected above 3σ in the 3-10 keV and/or 10-25 keV band are listed in the table below. Fluxes are extracted at the known catalogue position of the source (i.e. no fitting of the source position is done), with
mosaic_spec, in two bands: A = 3-10 keV (1 Crab ~ 97 cps [J1], 103 cps [J2]); B = 10-25 keV (1 Crab ~ 29 cps [J1], 27 cps [J2]). NOTES: The object marked as SLX 1744-299_300 is used to indicate two low-mass x-ray binaries separated by 2.7 arcminutes, SLX 1744-299 and SLX 1744-300; the position for SLX 1744-299 is used, although it can not be ruled out that SLX 1744-300 may dominate the emission some of the time. The systematic noise increases towards the edge of the field of view and in the vicinity of very bright sources, such as GX 5-1;
NEW SOURCEs < 6σ towards the border of the image and/or near GX 5-1 may, therefore, be spurious.
JEM-X1 Detected Sources in 3-10 keV (A) and 10-25 keV (B).
Source Name             RA       dec      l        b     A(cps)  +/-   sig  B(cps)  +/-   sig
==================== ========  ======= ======== ======== ====== ===== ===== ====== ===== =====
1A 1742-294           266.541  -29.505  359.576   -0.397    1.7  0.28   6.2    0.7  0.17   4.2
4U 1722-30            261.888  -30.802  356.320   +2.298    3.2  0.52   6.0    0.0  0.00   0.0
GX 1+4                263.009  -24.746    1.937   +4.795    3.3  0.99   3.4    1.1  0.63   1.8
GX 3+1                266.987  -26.567    2.292   +0.789   33.4  0.46  72.2    3.9  0.24  16.4
GX 354-0              262.994  -33.831  354.307   -0.152   19.6  1.14  17.1    3.4  0.82   4.2
GX 5-1                270.285  -25.083    5.074   -1.021   89.5  1.77  50.5   17.6  0.87  20.1
SLX 1744-299_300      266.858  -29.999  359.297   -0.889    1.7  0.28   6.0    0.5  0.18   2.8
XTE J1739-285         264.975  -28.496  359.714   +1.298    1.4  0.29   4.8    0.3  0.17   1.5
NEW SOURCE            267.252  -22.561    5.852   +2.647   11.5  2.65   4.3    0.0  0.00   0.0
NEW SOURCE            269.132  -25.662    4.053   -0.406    3.1  0.73   4.2    0.0  0.00   0.0
NEW SOURCE            269.047  -23.259    6.091   +0.868    9.1  2.22   4.1    2.0  1.37   1.4
NEW SOURCE            264.576  -22.870    4.297   +4.592    9.1  2.61   3.5    0.0  0.00   0.0
NEW SOURCE            272.012  -24.794    6.093   -2.244   15.8  4.11   3.9    2.7  2.52   1.1
1A 1743-288           266.758  -28.888    0.201   -0.239    1.0  0.29   3.3    0.4  0.18   2.3