INTEGRAL Galactic bulge Monitoring
Revolution 0410: Observation start 2006-02-20T20:52 = MJD 53786.87
Total Observation GTI = 11812 seconds
IBIS/ISGRI
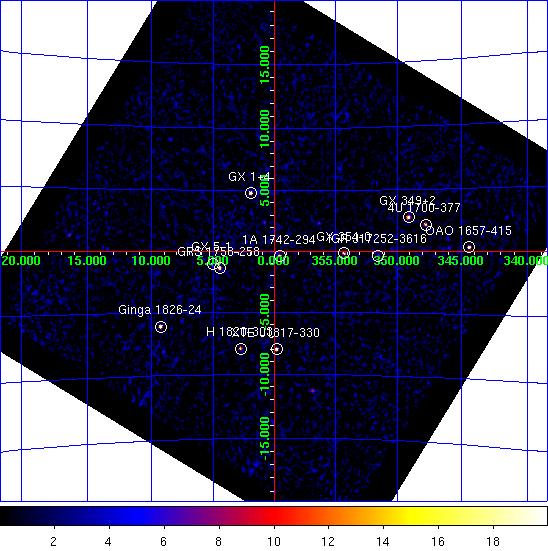

IBIS/ISGRI significance mosaic images. Left: IBIS/ISGRI 18-40 keV. Right: 40-100 keV
Sources detected > 10σ in each band are marked on the image. The table below lists the fitted position, and statistical positional uncertainty in arcmin returned by the mosaic step of
OSA10.1, of all the sources detected in the 18 - 40 keV range (band A: 1 Crab ~ 208 cps ) and 40 - 100 keV range (band B: 1 Crab ~ 100 cps ) where available.NOTES: The table is constructed from the
isgri_mosa_res.fits file - fluxes in the mosaic output are known to be systematically ~10% lower than in the ScW light-curves (see known issues). The systematic noise increases towards the edge of the field of view and NEW SOURCEs < 6σ towards the border of the image may be spurious. IBIS/ISGRI Detected Sources 18-40 keV (A) and 40-100 keV (B)
Source Name             RA       dec   +/-    l        b     A(cps)  +/-   sig  B(cps)  +/-   sig
==================== ========  ======= === ======== ======== ====== ===== ===== ====== ===== =====
GX 1+4                263.006  -24.741 0.9    1.939   +4.800   12.4  0.33  37.8    0.0  0.00   0.0
GRS 1758-258          270.297  -25.748 1.0    4.502   -1.360   10.4  0.34  30.6    5.9  0.28  21.5
XTE J1817-330         274.433  -33.018 1.0  359.818   -7.997   13.2  0.42  31.2    6.0  0.34  17.8
GX 349+2              256.426  -36.421 1.1  349.100   +2.756   17.0  0.58  29.4    0.0  0.00   0.0
Ginga 1826-24         277.365  -23.792 1.1    9.276   -6.083   17.3  0.61  28.6    6.9  0.47  14.7
GX 5-1                270.288  -25.074 1.2    5.084   -1.019    8.3  0.32  25.6    0.0  0.00   0.0
1A 1742-294           266.518  -29.511 1.3  359.560   -0.383    6.6  0.28  23.4    1.9  0.24   8.2
OAO 1657-415          255.204  -41.654 1.2  344.371   +0.320   37.5  1.54  24.3    6.9  1.14   6.1
GX 354-0              262.997  -33.847 1.2  354.296   -0.163    8.2  0.34  24.4    0.0  0.00   0.0
4U 1700-377           255.995  -37.848 1.4  347.755   +2.166   13.4  0.65  20.7    2.3  0.50   4.7
H 1820-303            275.925  -30.372 1.5    2.781   -7.923    8.8  0.47  18.6    0.0  0.00   0.0
3A 1822-371           276.460  -37.108 2.7  356.853  -11.302    6.0  0.61  10.0    0.0  0.00   0.0
IGR J17252-3616       261.314  -36.278 2.5  351.509   -0.363    4.8  0.46  10.5    0.0  0.00   0.0
GX 17+2               273.971  -14.043 2.8   16.410   +1.304   23.0  2.46   9.3    0.0  0.00   0.0
SLX 1735-269          264.586  -26.984 3.2    0.811   +2.395    2.9  0.36   8.1    0.0  0.00   0.0
4U 1722-30            261.890  -30.785 3.2  356.335   +2.306    2.8  0.35   8.1    0.0  0.00   0.0
SLX 1744-299_300      266.822  -29.974 3.7  359.302   -0.850    2.1  0.30   6.9    0.0  0.00   0.0
GX 3+1                266.999  -26.544 3.5    2.318   +0.792    2.6  0.35   7.3    0.0  0.00   0.0
3A 1728-169           262.905  -16.963 4.1    8.497   +9.061    4.3  0.70   6.1    0.0  0.00   0.0
GX 13+1               273.550  -17.154 4.2   13.482   +0.176    4.9  0.81   6.0    0.0  0.00   0.0
Swift J174535.5-2901  266.401  -29.086 0.0  359.870   -0.075    1.2  0.00   4.2    0.0  0.00   0.0
1E 1743.1-2843        266.561  -28.707 5.7    0.267   +0.002    1.2  0.28   4.3    0.0  0.00   0.0
GX 9+1                270.413  -20.596 6.0    9.032   +1.097    1.8  0.45   4.0    0.0  0.00   0.0
GRS 1747-312          267.555  -31.301 6.5  358.489   -2.074    1.3  0.00   3.7    0.0  0.00   0.0
Oph Cluster           258.187  -23.420 6.5    0.570   +9.188    1.8  0.49   3.7    0.0  0.00   0.0
SLX 1737-282          265.197  -28.258 8.9    0.020   +1.258    0.8  0.30   2.6    0.0  0.00   0.0
V2400 Oph             258.259  -24.187 0.0  359.972   +8.693    1.7  0.00   3.6    0.0  0.00   0.0
IGR J17464-2811       266.868  -28.262 6.9    0.787   +0.003    1.0  0.00   3.5    0.0  0.00   0.0
XTE J1743-363         265.836  -36.336 7.0  353.436   -3.456    1.4  0.42   3.4    0.0  0.00   0.0
IGR J16316-4028       247.791  -40.416 7.1  341.680   +5.376   16.7  0.00   3.4    0.0  0.00   0.0
JEM-X
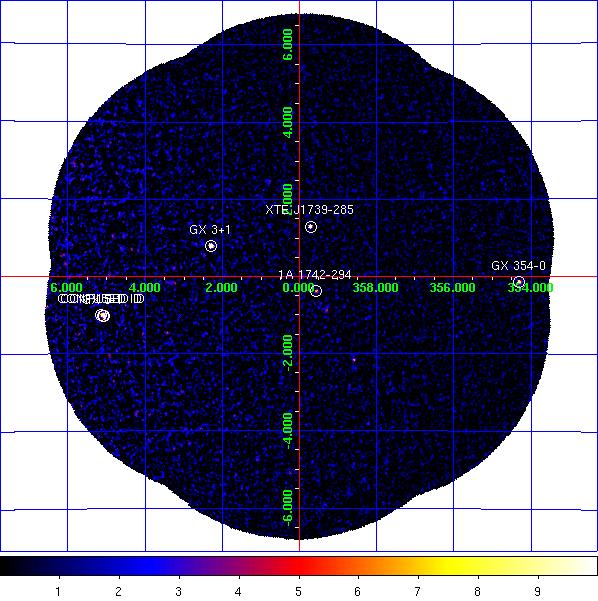
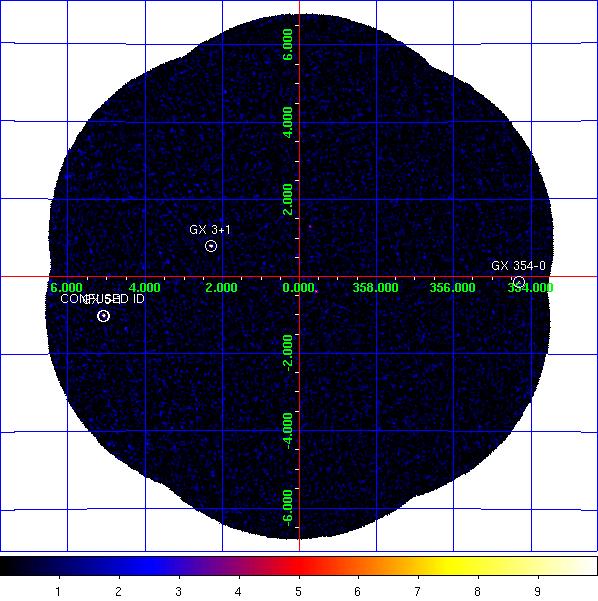
JEM-X1 significance mosaic images. Left: 3-10 keV. Right: 10-25 keV.
Sources labelled were detected in the 3-10 keV image > 6σ. The sources detected above 3σ in the 3-10 keV and/or 10-25 keV band are listed in the table below. Fluxes are extracted at the known catalogue position of the source (i.e. no fitting of the source position is done), with
mosaic_spec, in two bands: A = 3-10 keV (1 Crab ~ 97 cps [J1], 103 cps [J2]); B = 10-25 keV (1 Crab ~ 29 cps [J1], 27 cps [J2]). NOTES: The object marked as SLX 1744-299_300 is used to indicate two low-mass x-ray binaries separated by 2.7 arcminutes, SLX 1744-299 and SLX 1744-300; the position for SLX 1744-299 is used, although it can not be ruled out that SLX 1744-300 may dominate the emission some of the time. The systematic noise increases towards the edge of the field of view and in the vicinity of very bright sources, such as GX 5-1;
NEW SOURCEs < 6σ towards the border of the image and/or near GX 5-1 may, therefore, be spurious.
JEM-X1 Detected Sources in 3-10 keV (A) and 10-25 keV (B).
Source Name             RA       dec      l        b     A(cps)  +/-   sig  B(cps)  +/-   sig
==================== ========  ======= ======== ======== ====== ===== ===== ====== ===== =====
1A 1742-294           266.523  -29.515  359.559   -0.389    2.1  0.29   7.3    1.0  0.17   5.6
GRS 1747-312          267.690  -31.292  358.555   -2.168    1.9  0.36   5.4    0.0  0.00   0.0
GX 3+1                266.986  -26.569    2.291   +0.789   26.2  0.45  58.0    3.1  0.23  13.2
GX 354-0              262.989  -33.830  354.306   -0.147   33.5  1.31  25.6    6.2  0.86   7.2
GX 5-1                270.295  -25.072    5.088   -1.023  107.1  1.88  56.9   10.4  0.82  12.7
SLX 1735-269          264.571  -26.994    0.796   +2.400    1.2  0.38   3.2    0.0  0.00   0.0
SLX 1744-299_300      266.858  -29.999  359.297   -0.889    1.7  0.30   5.8    0.3  0.18   2.0
Swift J174535.5-2901  266.398  -29.026  359.920   -0.042    1.1  0.30   3.7    0.2  0.17   1.3
XTE J1739-285         264.978  -28.499  359.714   +1.295    6.8  0.30  22.3    0.7  0.17   3.9
CONFUSED ID           270.282  -25.074    5.081   -1.014  111.2  1.88  59.1   11.1  0.82  13.6
NEW SOURCE            269.541  -23.558    6.060   +0.326   12.9  2.47   5.2    1.7  1.43   1.2
CONFUSED ID           270.316  -25.000    5.160   -1.005   27.5  1.74  15.9    2.1  0.81   2.5
NEW SOURCE            266.999  -22.422    5.851   +2.919   16.1  2.97   5.4    0.0  0.00   0.0