INTEGRAL Galactic bulge Monitoring
Revolution 0360: Observation start 2005-09-26T19:31 = MJD 53639.814
Total Observation GTI = 13686 seconds
IBIS/ISGRI
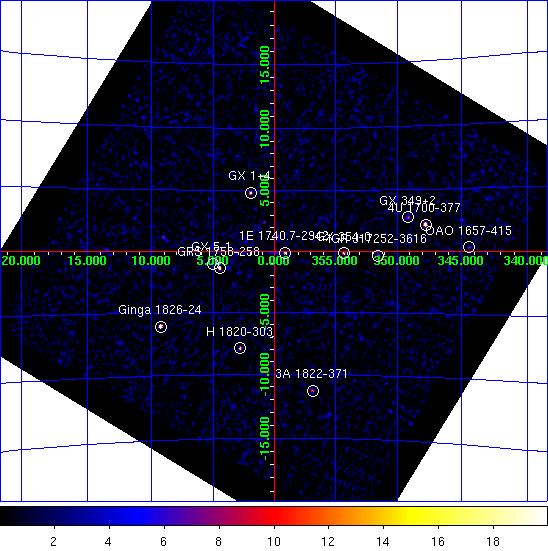
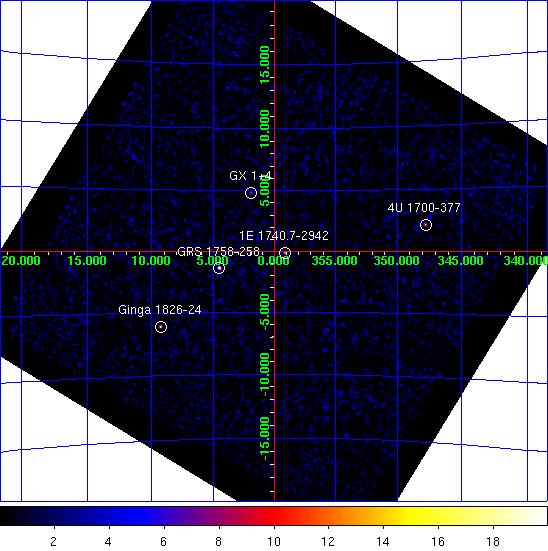
IBIS/ISGRI significance mosaic images. Left: IBIS/ISGRI 18-40 keV. Right: 40-100 keV
Sources detected > 10σ in each band are marked on the image. The table below lists the fitted position, and statistical positional uncertainty in arcmin returned by the mosaic step of
OSA10.1, of all the sources detected in the 18 - 40 keV range (band A: 1 Crab ~ 208 cps ) and 40 - 100 keV range (band B: 1 Crab ~ 100 cps ) where available.NOTES: The table is constructed from the
isgri_mosa_res.fits file - fluxes in the mosaic output are known to be systematically ~10% lower than in the ScW light-curves (see known issues). The systematic noise increases towards the edge of the field of view and NEW SOURCEs < 6σ towards the border of the image may be spurious. IBIS/ISGRI Detected Sources 18-40 keV (A) and 40-100 keV (B)
Source Name             RA       dec   +/-    l        b     A(cps)  +/-   sig  B(cps)  +/-   sig
==================== ========  ======= === ======== ======== ====== ===== ===== ====== ===== =====
GRS 1758-258          270.299  -25.742 0.8    4.508   -1.359   13.3  0.34  38.9    8.0  0.28  28.9
4U 1700-377           256.000  -37.847 0.9  347.758   +2.163   23.5  0.66  35.6    7.8  0.51  15.2
Ginga 1826-24         277.361  -23.793 0.9    9.274   -6.080   20.4  0.54  37.7    7.3  0.42  17.5
GX 1+4                263.012  -24.731 1.1    1.950   +4.800    8.1  0.30  26.6    0.0  0.00   0.0
1E 1740.7-2942        265.978  -29.750 1.2  359.112   -0.108    6.9  0.29  23.8    4.2  0.24  17.3
GX 354-0              262.990  -33.838 1.3  354.300   -0.152    7.1  0.31  23.2    0.0  0.00   0.0
H 1820-303            275.935  -30.349 1.5    2.805   -7.921    8.0  0.43  18.6    0.0  0.00   0.0
3A 1822-371           276.449  -37.087 2.1  356.868  -11.286    7.7  0.58  13.1    0.0  0.00   0.0
GX 349+2              256.422  -36.406 2.2  349.111   +2.767    7.2  0.57  12.5    0.0  0.00   0.0
GX 5-1                270.266  -25.059 2.2    5.087   -0.994    3.9  0.32  12.5    0.0  0.00   0.0
IGR J17252-3616       261.296  -36.269 2.1  351.508   -0.345    5.4  0.41  13.1    0.0  0.00   0.0
OAO 1657-415          255.196  -41.661 2.6  344.362   +0.320   13.8  1.36  10.1    5.1  1.03   4.9
XTE J1739-285         264.995  -28.524 3.0  359.700   +1.269    2.5  0.28   8.7    1.3  0.23   5.5
SLX 1744-299_300      266.878  -29.979 3.3  359.323   -0.893    2.5  0.32   7.9    1.3  0.27   4.6
GX 9+1                270.374  -20.598 3.5    9.012   +1.128    3.0  0.41   7.4    0.0  0.00   0.0
SLX 1735-269          264.597  -26.960 2.8    0.837   +2.399    2.7  0.28   9.5    0.0  0.00   0.0
GRO J1655-40          253.442  -39.861 3.2  344.942   +2.482    8.5  1.06   8.0    4.8  0.78   6.2
GX 13+1               273.640  -17.115 3.7   13.558   +0.119    5.0  0.74   6.8    0.0  0.00   0.0
SGR J1745-29          266.474  -29.017 3.4  359.962   -0.093    1.9  0.25   7.5    0.0  0.00   0.0
GX 3+1                266.976  -26.514 4.4    2.333   +0.825    1.5  0.27   5.7    0.0  0.00   0.0
1RXS J163759.7-26062  249.474  -26.142 5.8  353.456  +13.811    8.4  2.00   4.2    0.0  0.00   0.0
KS 1741-293           266.212  -29.336 0.0  359.571   -0.064    1.3  0.00   4.9    0.7  0.00   3.3
AX J1749.1-2733       267.297  -27.493 4.8    1.642   +0.075    1.6  0.30   5.1    0.0  0.00   0.0
1A 1744-361           267.006  -36.045 0.0  354.175   -4.114    1.5  0.00   4.3    0.0  0.00   0.0
IGR J17464-3213       266.638  -32.192 7.0  357.323   -1.864    1.1  0.32   3.4    0.0  0.00   0.0
1E 1743.1-2843        266.588  -28.677 0.0    0.305   -0.002    1.1  0.00   4.1    0.0  0.00   0.0
1RXS J170849.0-40091  257.150  -40.160 0.0  346.451   +0.057    2.9  0.00   4.0    0.0  0.00   0.0
SLX 1746-331          267.380  -33.110 6.2  356.858   -2.873    1.1  0.00   3.9    0.0  0.00   0.0
1RXS J175721.2-30440  269.404  -30.843 6.0  359.686   -3.209    1.1  0.28   4.1    0.0  0.00   0.0
GX 17+2               274.025  -14.052 7.9   16.428   +1.254    8.9  2.96   3.0    0.0  0.00   0.0
SAX J1712.6-3739      258.115  -37.611 0.0  348.949   +0.964    1.8  0.00   3.5    0.0  0.00   0.0
GRS 1734-292          264.403  -29.077 6.7  358.955   +1.413    1.0  0.28   3.6    0.0  0.00   0.0
JEM-X
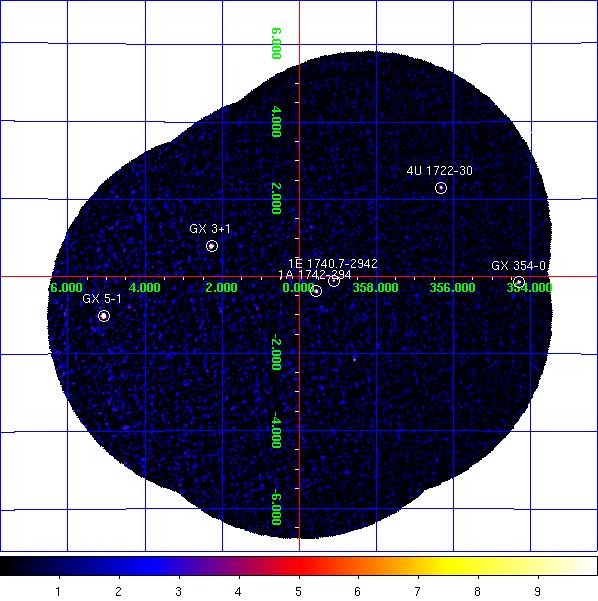
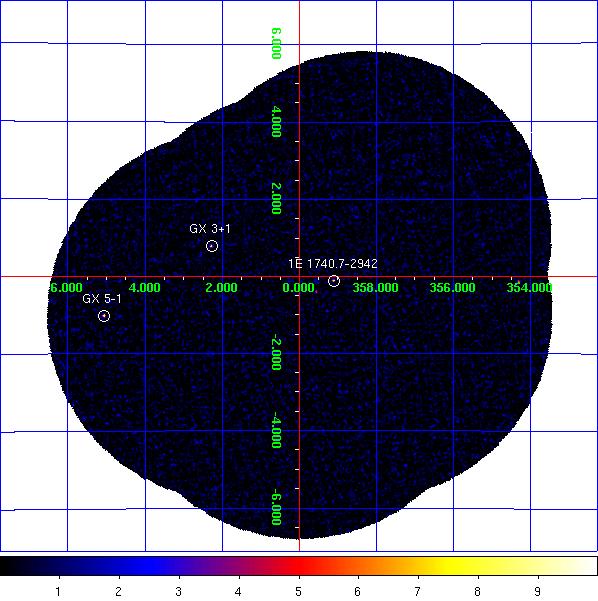
JEM-X1 significance mosaic images. Left: 3-10 keV. Right: 10-25 keV.
Sources labelled were detected in the 3-10 keV image > 6σ. The sources detected above 3σ in the 3-10 keV and/or 10-25 keV band are listed in the table below. Fluxes are extracted at the known catalogue position of the source (i.e. no fitting of the source position is done), with
mosaic_spec, in two bands: A = 3-10 keV (1 Crab ~ 97 cps [J1], 103 cps [J2]); B = 10-25 keV (1 Crab ~ 29 cps [J1], 27 cps [J2]). NOTES: The object marked as SLX 1744-299_300 is used to indicate two low-mass x-ray binaries separated by 2.7 arcminutes, SLX 1744-299 and SLX 1744-300; the position for SLX 1744-299 is used, although it can not be ruled out that SLX 1744-300 may dominate the emission some of the time. The systematic noise increases towards the edge of the field of view and in the vicinity of very bright sources, such as GX 5-1;
NEW SOURCEs < 6σ towards the border of the image and/or near GX 5-1 may, therefore, be spurious.
JEM-X1 Detected Sources in 3-10 keV (A) and 10-25 keV (B).
Source Name             RA       dec      l        b     A(cps)  +/-   sig  B(cps)  +/-   sig
==================== ========  ======= ======== ======== ====== ===== ===== ====== ===== =====
1A 1742-294           266.520  -29.513  359.560   -0.386    4.1  0.26  15.7    0.6  0.15   4.1
1E 1740.7-2942        265.978  -29.745  359.116   -0.106    2.1  0.27   7.9    1.1  0.16   6.8
1E 1743.1-2843        266.587  -28.729    0.260   -0.029    0.8  0.28   3.0    0.2  0.16   1.5
4U 1722-30            261.886  -30.800  356.320   +2.300    7.6  0.70  10.8    0.8  0.49   1.7
GRS 1747-312          267.690  -31.292  358.555   -2.168    1.4  0.27   5.3    0.2  0.17   1.5
GX 3+1                266.972  -26.573    2.281   +0.797   19.9  0.51  38.8    2.0  0.27   7.2
GX 354-0              262.994  -33.838  354.301   -0.155   16.8  1.24  13.5    4.6  0.92   5.1
GX 5-1                270.286  -25.082    5.075   -1.022   91.0  1.77  51.5    5.9  0.74   7.9
SLX 1744-299_300      266.858  -29.999  359.297   -0.889    0.8  0.25   3.0    0.3  0.16   2.1
XTE J1739-285         264.975  -28.496  359.714   +1.298    1.3  0.34   3.9    0.3  0.20   1.4
NEW SOURCE            270.784  -24.193    6.072   -0.976   13.0  2.73   4.8    0.0  0.00   0.0
NEW SOURCE            269.697  -25.537    4.416   -0.786    4.2  0.87   4.8    0.0  0.00   0.0