INTEGRAL Galactic bulge Monitoring
Revolution 0354: Observation start 2005-09-07T03:04 = MJD 53620.129
Total Observation GTI = 12130 seconds
IBIS/ISGRI
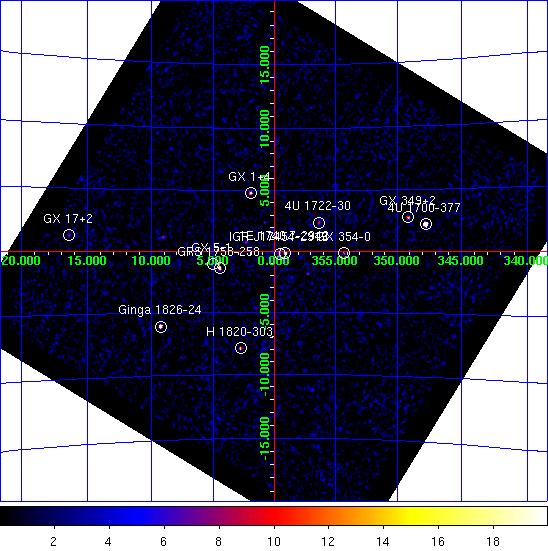
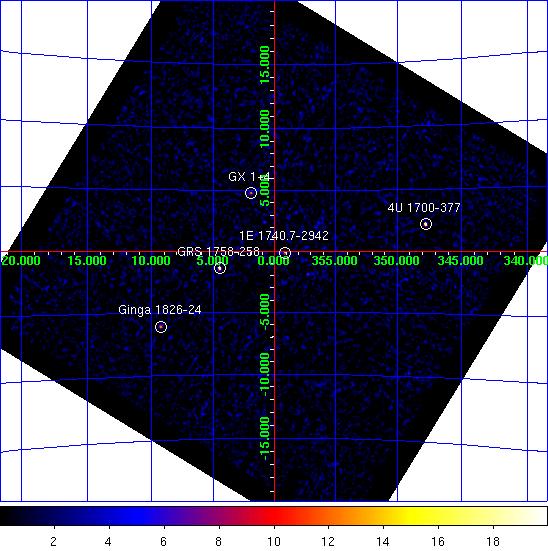
IBIS/ISGRI significance mosaic images. Left: IBIS/ISGRI 18-40 keV. Right: 40-100 keV
Sources detected > 10σ in each band are marked on the image. The table below lists the fitted position, and statistical positional uncertainty in arcmin returned by the mosaic step of
OSA10.1, of all the sources detected in the 18 - 40 keV range (band A: 1 Crab ~ 208 cps ) and 40 - 100 keV range (band B: 1 Crab ~ 100 cps ) where available.NOTES: The table is constructed from the
isgri_mosa_res.fits file - fluxes in the mosaic output are known to be systematically ~10% lower than in the ScW light-curves (see known issues). The systematic noise increases towards the edge of the field of view and NEW SOURCEs < 6σ towards the border of the image may be spurious. IBIS/ISGRI Detected Sources 18-40 keV (A) and 40-100 keV (B)
Source Name             RA       dec   +/-    l        b     A(cps)  +/-   sig  B(cps)  +/-   sig
==================== ========  ======= === ======== ======== ====== ===== ===== ====== ===== =====
4U 1700-377           255.985  -37.843 0.5  347.754   +2.175   60.3  0.71  84.9   13.9  0.53  26.2
GRS 1758-258          270.305  -25.744 0.8    4.508   -1.364   12.4  0.31  40.0    7.2  0.25  29.0
Ginga 1826-24         277.360  -23.793 1.0    9.273   -6.080   18.9  0.58  32.6    6.5  0.45  14.6
1E 1740.7-2942        265.978  -29.748 1.2  359.113   -0.107    7.6  0.29  26.1    4.3  0.23  18.5
GX 1+4                263.015  -24.740 1.2    1.945   +4.793    9.0  0.35  25.9    0.0  0.00   0.0
GX 349+2              256.443  -36.419 1.5  349.110   +2.746   12.3  0.62  19.9    0.0  0.00   0.0
H 1820-303            275.919  -30.365 1.6    2.784   -7.915    8.2  0.46  17.8    0.0  0.00   0.0
IGR J17454-2919       266.345  -29.392 1.8  359.583   -0.193    4.1  0.27  15.2    0.0  0.00   0.0
GX 5-1                270.285  -25.097 2.0    5.062   -1.028    4.3  0.32  13.5    0.0  0.00   0.0
GX 354-0              262.972  -33.851 2.0  354.281   -0.147    4.7  0.34  13.7    1.0  0.27   3.9
GX 17+2               273.996  -14.033 2.2   16.430   +1.288   33.6  2.75  12.2    0.0  0.00   0.0
4U 1722-30            261.829  -30.778 2.5  356.311   +2.354    3.2  0.31  10.6    1.1  0.24   4.7
GX 9+1                270.410  -20.508 3.0    9.107   +1.143    4.2  0.48   8.7    0.0  0.00   0.0
GX 3+1                267.013  -26.563 2.7    2.308   +0.771    2.8  0.28   9.7    0.0  0.00   0.0
IGR J17464-3213       266.545  -32.237 2.8  357.243   -1.820    2.9  0.30   9.5    1.8  0.25   7.4
SLX 1735-269          264.590  -26.997 3.2    0.802   +2.385    2.3  0.29   8.1    1.6  0.23   7.0
SLX 1737-282          265.122  -28.313 4.3  359.938   +1.286    1.6  0.27   5.9    0.0  0.00   0.0
3A 1822-371           276.395  -37.019 4.7  356.911  -11.217    3.3  0.62   5.3    0.0  0.00   0.0
V2400 Oph             258.075  -24.230 4.8  359.839   +8.806    2.3  0.45   5.2    0.0  0.00   0.0
GRS 1747-312          267.757  -31.261 7.8  358.612   -2.202    0.9  0.29   3.1    0.0  0.00   0.0
3A 1728-169           262.923  -16.954 4.4    8.514   +9.051    4.2  0.74   5.7    0.0  0.00   0.0
SLX 1744-299_300      266.768  -30.050 4.7  359.213   -0.849    1.4  0.28   5.2    0.0  0.00   0.0
1E 1742.8-2853        266.401  -28.922 0.0    0.011   +0.011    1.3  0.00   4.9    0.0  0.00   0.0
IGR J17361-4441       264.096  -44.780 4.6  345.528   -6.776   20.3  3.78   5.4    0.0  0.00   0.0
IGR J17488-3253       267.141  -32.917 4.8  356.921   -2.602    1.6  0.31   5.1    0.0  0.00   0.0
IGR J18027-2016       270.642  -20.215 0.0    9.469   +1.099    2.1  0.00   4.1    0.0  0.00   0.0
IGR J17252-3616       261.277  -36.276 6.3  351.493   -0.337    1.8  0.47   3.9    0.0  0.00   0.0
AX J1754.2-2754       268.693  -27.941 6.1    1.886   -1.216    1.1  0.28   4.0    0.0  0.00   0.0
IGR J17475-2822       266.775  -28.427 0.0    0.603   -0.013    1.0  0.00   3.7    0.0  0.00   0.0
IGR J18048-1455       271.258  -14.926 6.6   14.370   +3.181    4.7  1.27   3.7    0.0  0.00   0.0
GRO J1744-28          266.025  -28.756 0.0  359.979   +0.378    1.0  0.00   3.6    0.0  0.00   0.0
XTE J1817-330         274.379  -32.925 7.5  359.881   -7.913    1.3  0.41   3.2    1.2  0.00   3.7
GX 13+1               273.618  -17.108 7.1   13.553   +0.141    2.8  0.00   3.4    0.0  0.00   0.0
Swift J165534.1-4426  253.894  -44.502 5.8  341.545   -0.700   39.4  9.27   4.2    0.0  0.00   0.0
XB 1733-30            263.922  -30.379 7.1  357.633   +1.064    0.9  0.00   3.4    0.0  0.00   0.0
IGR J16482-3036       252.107  -30.556 3.9  351.498   +9.211    4.8  0.73   6.5    0.0  0.00   0.0
NEW SOURCE            266.684  -29.497 0.0  359.648   -0.500    1.7  0.00   6.4    0.0  0.00   0.0
JEM-X
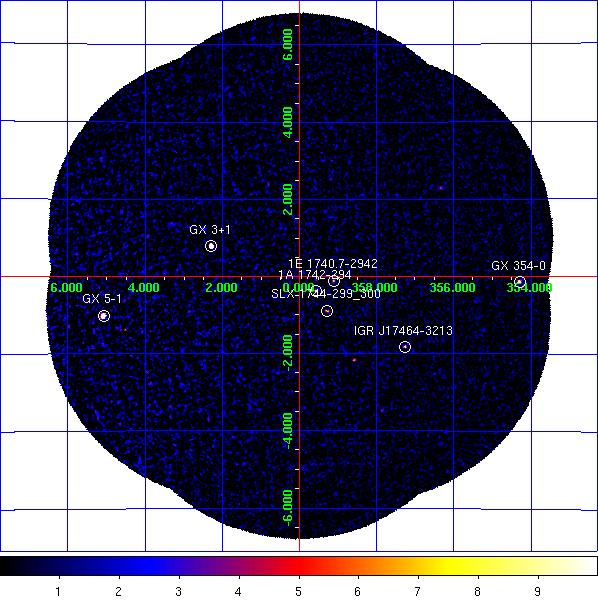
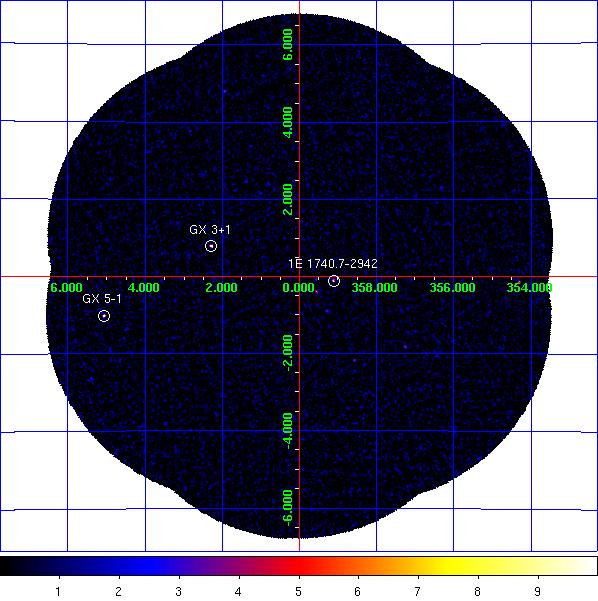
JEM-X1 significance mosaic images. Left: 3-10 keV. Right: 10-25 keV.
Sources labelled were detected in the 3-10 keV image > 6σ. The sources detected above 3σ in the 3-10 keV and/or 10-25 keV band are listed in the table below. Fluxes are extracted at the known catalogue position of the source (i.e. no fitting of the source position is done), with
mosaic_spec, in two bands: A = 3-10 keV (1 Crab ~ 97 cps [J1], 103 cps [J2]); B = 10-25 keV (1 Crab ~ 29 cps [J1], 27 cps [J2]). NOTES: The object marked as SLX 1744-299_300 is used to indicate two low-mass x-ray binaries separated by 2.7 arcminutes, SLX 1744-299 and SLX 1744-300; the position for SLX 1744-299 is used, although it can not be ruled out that SLX 1744-300 may dominate the emission some of the time. The systematic noise increases towards the edge of the field of view and in the vicinity of very bright sources, such as GX 5-1;
NEW SOURCEs < 6σ towards the border of the image and/or near GX 5-1 may, therefore, be spurious.
JEM-X1 Detected Sources in 3-10 keV (A) and 10-25 keV (B).
Source Name             RA       dec      l        b     A(cps)  +/-   sig  B(cps)  +/-   sig
==================== ========  ======= ======== ======== ====== ===== ===== ====== ===== =====
1A 1742-294           266.523  -29.515  359.559   -0.389    2.4  0.25   9.3    0.7  0.15   4.9
1E 1740.7-2942        265.978  -29.745  359.116   -0.106    1.9  0.26   7.3    1.2  0.16   7.9
1E 1743.1-2843        266.587  -28.729    0.260   -0.029    0.8  0.26   3.3    0.2  0.15   1.6
4U 1722-30            261.888  -30.802  356.320   +2.298    3.1  0.56   5.5    1.0  0.40   2.5
GRS 1747-312          267.690  -31.292  358.555   -2.168    1.5  0.31   4.8    0.6  0.19   3.2
GRS 1758-258          270.303  -25.741    4.511   -1.361    2.9  0.90   3.2    1.0  0.44   2.2
GX 1+4                263.009  -24.746    1.937   +4.795    0.0  0.00   0.0    2.3  0.61   3.8
GX 3+1                266.995  -26.565    2.298   +0.784   25.4  0.40  64.2    2.6  0.20  13.0
GX 354-0              262.990  -33.841  354.297   -0.154   20.1  1.24  16.2    4.0  0.88   4.6
GX 5-1                270.283  -25.074    5.081   -1.015   99.9  1.55  64.4    7.3  0.64  11.5
IGR J17464-3213       266.567  -32.229  357.260   -1.832    3.4  0.37   9.3    0.9  0.24   4.0
SLX 1735-269          264.571  -26.994    0.796   +2.400    1.1  0.33   3.4    0.5  0.20   2.6
SLX 1744-299_300      266.858  -29.999  359.297   -0.889    1.8  0.26   6.9    0.5  0.16   3.2
NEW SOURCE            271.334  -26.995    3.872   -2.782    3.6  0.82   4.4    0.0  0.00   0.0
NEW SOURCE            271.041  -24.435    5.977   -1.299   10.0  2.64   3.8    0.0  0.00   0.0
NEW SOURCE            267.677  -25.023    3.936   +1.050    2.6  0.65   4.0    0.0  0.00   0.0
KS 1741-293           266.221  -29.346  359.566   -0.076    1.0  0.25   4.0    0.5  0.15   3.3