INTEGRAL Galactic bulge Monitoring
Revolution 0350: Observation start 2005-08-25T13:00 = MJD 53607.542
Total Observation GTI = 11867 seconds
IBIS/ISGRI
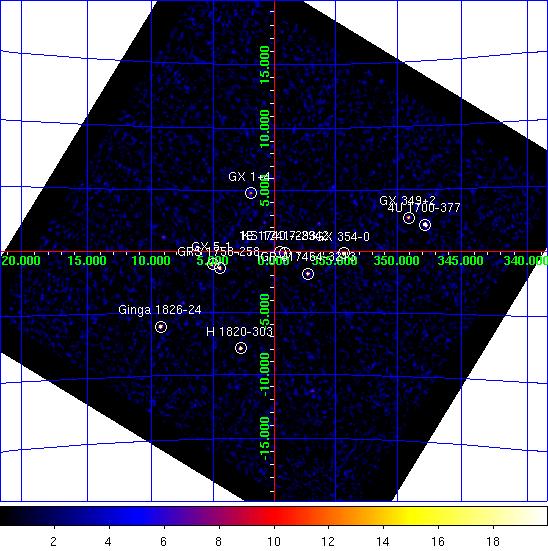
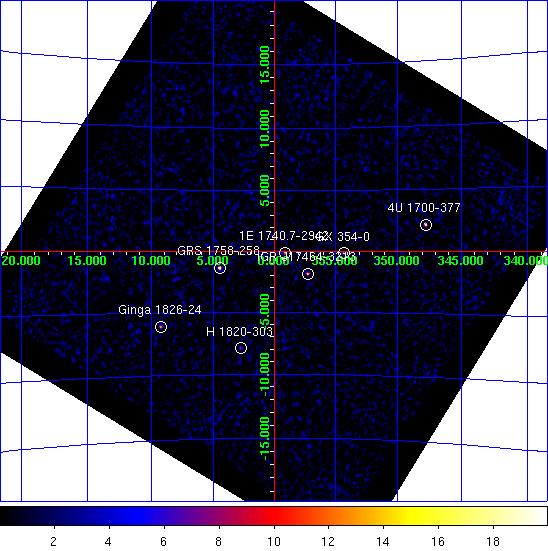
IBIS/ISGRI significance mosaic images. Left: IBIS/ISGRI 18-40 keV. Right: 40-100 keV
Sources detected > 10σ in each band are marked on the image. The table below lists the fitted position, and statistical positional uncertainty in arcmin returned by the mosaic step of
OSA10.1, of all the sources detected in the 18 - 40 keV range (band A: 1 Crab ~ 208 cps ) and 40 - 100 keV range (band B: 1 Crab ~ 100 cps ) where available.NOTES: The table is constructed from the
isgri_mosa_res.fits file - fluxes in the mosaic output are known to be systematically ~10% lower than in the ScW light-curves (see known issues). The systematic noise increases towards the edge of the field of view and NEW SOURCEs < 6σ towards the border of the image may be spurious. IBIS/ISGRI Detected Sources 18-40 keV (A) and 40-100 keV (B)
Source Name             RA       dec   +/-    l        b     A(cps)  +/-   sig  B(cps)  +/-   sig
==================== ========  ======= === ======== ======== ====== ===== ===== ====== ===== =====
GX 5-1                270.283  -25.080 0.7    5.076   -1.018   18.7  0.34  54.9    0.0  0.00   0.0
4U 1700-377           256.009  -37.845 0.7  347.765   +2.159   37.0  0.71  52.5   11.1  0.52  21.4
GRS 1758-258          270.294  -25.743 0.9    4.505   -1.355   13.7  0.36  38.3    8.4  0.28  29.7
GX 354-0              262.997  -33.835 0.9  354.306   -0.155   13.6  0.36  38.0    3.6  0.28  12.9
H 1820-303            275.922  -30.357 1.0    2.794   -7.914   16.0  0.50  32.1    3.9  0.38  10.3
Ginga 1826-24         277.369  -23.792 1.1    9.278   -6.087   18.4  0.63  29.1    6.9  0.47  14.6
IGR J17464-3213       266.562  -32.233 1.2  357.254   -1.831    8.4  0.33  25.4    4.2  0.27  15.7
1E 1740.7-2942        265.998  -29.745 1.2  359.125   -0.120    7.6  0.32  23.9    5.1  0.26  20.0
GX 349+2              256.438  -36.429 1.4  349.100   +2.743   13.2  0.63  20.8    0.0  0.00   0.0
KS 1741-293           266.213  -29.336 0.0  359.571   -0.065    4.0  0.00  13.2    1.8  0.00   7.3
GX 1+4                263.031  -24.729 1.9    1.962   +4.787    5.0  0.35  14.3    0.0  0.00   0.0
3A 1822-371           276.492  -37.087 2.9  356.883  -11.317    5.9  0.66   9.0    0.0  0.00   0.0
4U 1722-30            261.904  -30.805 3.1  356.325   +2.285    3.2  0.38   8.4    1.1  0.30   3.8
XTE J1818-245         274.623  -24.511 2.9    7.476   -4.196    4.3  0.48   8.9    1.6  0.36   4.5
IGR J17252-3616       261.290  -36.302 2.9  351.478   -0.360    4.4  0.49   9.0    0.0  0.00   0.0
SLX 1744-299_300      266.863  -30.063 3.2  359.244   -0.926    2.6  0.32   8.2    0.0  0.00   0.0
GX 9+1                270.359  -20.555 2.9    9.042   +1.162    4.3  0.47   9.0    0.0  0.00   0.0
MXB 1730-335          263.331  -33.399 3.4  354.823   -0.151    2.6  0.34   7.6    0.0  0.00   0.0
SLX 1735-269          264.588  -26.980 3.4    0.816   +2.395    3.0  0.40   7.5    1.3  0.32   4.1
GX 3+1                266.971  -26.593 4.7    2.263   +0.788    1.9  0.36   5.3    0.0  0.00   0.0
4U 1735-444           264.760  -44.527 4.7  345.994   -7.045   24.5  4.66   5.3    0.0  0.00   0.0
GX 13+1               273.598  -17.164 5.1   13.495   +0.132    4.1  0.85   4.8    0.0  0.00   0.0
Oph Cluster           258.171  -23.256 5.7    0.697   +9.294    2.3  0.54   4.3    0.0  0.00   0.0
GX 17+2               274.004  -14.059 5.2   16.412   +1.268   12.0  2.54   4.7    0.0  0.00   0.0
OAO 1657-415          255.203  -41.673 6.1  344.356   +0.309    6.7  1.69   4.0    0.0  0.00   0.0
IGR J17456-2901       266.402  -28.924 0.0    0.008   +0.009    1.2  0.00   4.1    0.0  0.00   0.0
3A 1728-169           262.953  -16.978 5.8    8.509   +9.014    3.1  0.74   4.2    0.0  0.00   0.0
QSO B1730-130         263.315  -13.109 6.5   12.036  +10.752   13.3  0.00   3.7    0.0  0.00   0.0
JEM-X
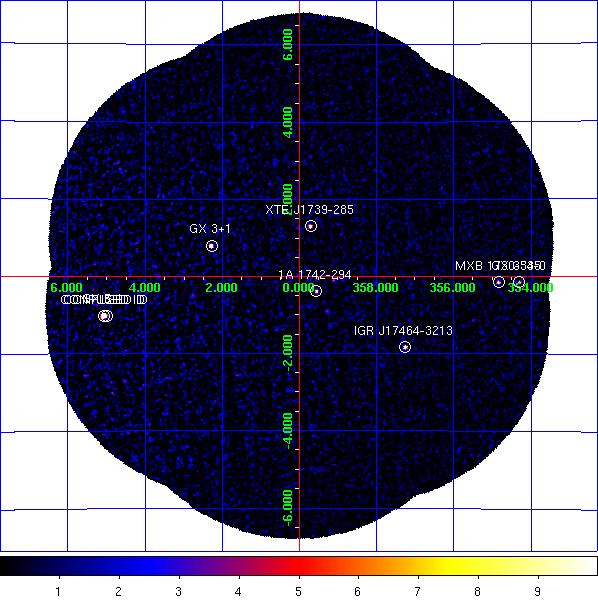
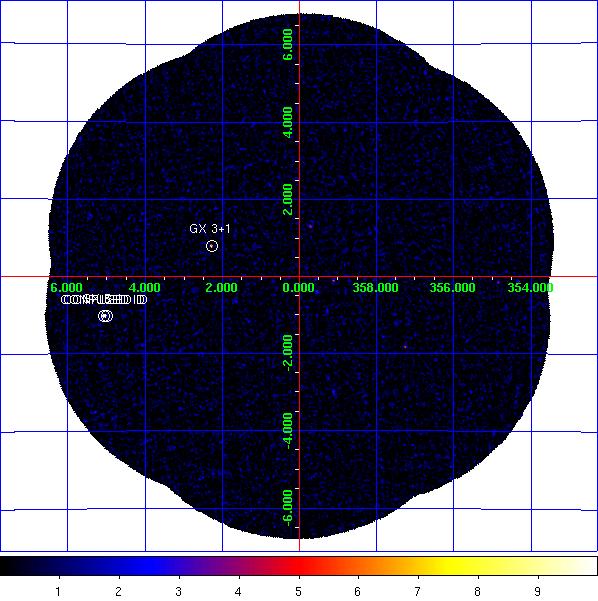
JEM-X1 significance mosaic images. Left: 3-10 keV. Right: 10-25 keV.
Sources labelled were detected in the 3-10 keV image > 6σ. The sources detected above 3σ in the 3-10 keV and/or 10-25 keV band are listed in the table below. Fluxes are extracted at the known catalogue position of the source (i.e. no fitting of the source position is done), with
mosaic_spec, in two bands: A = 3-10 keV (1 Crab ~ 97 cps [J1], 103 cps [J2]); B = 10-25 keV (1 Crab ~ 29 cps [J1], 27 cps [J2]). NOTES: The object marked as SLX 1744-299_300 is used to indicate two low-mass x-ray binaries separated by 2.7 arcminutes, SLX 1744-299 and SLX 1744-300; the position for SLX 1744-299 is used, although it can not be ruled out that SLX 1744-300 may dominate the emission some of the time. The systematic noise increases towards the edge of the field of view and in the vicinity of very bright sources, such as GX 5-1;
NEW SOURCEs < 6σ towards the border of the image and/or near GX 5-1 may, therefore, be spurious.
JEM-X1 Detected Sources in 3-10 keV (A) and 10-25 keV (B).
Source Name             RA       dec      l        b     A(cps)  +/-   sig  B(cps)  +/-   sig
==================== ========  ======= ======== ======== ====== ===== ===== ====== ===== =====
1A 1742-294           266.523  -29.515  359.559   -0.389    3.3  0.30  11.1    0.6  0.17   3.7
1E 1740.7-2942        265.978  -29.745  359.116   -0.106    1.7  0.30   5.8    0.9  0.18   5.0
1E 1743.1-2843        266.587  -28.729    0.260   -0.029    1.6  0.30   5.3    0.3  0.17   1.8
GX 3+1                266.973  -26.572    2.282   +0.798   15.8  0.41  38.4    1.7  0.22   7.7
GX 354-0              262.989  -33.835  354.302   -0.150   10.7  1.36   7.9    2.3  0.98   2.4
GX 5-1                270.285  -25.084    5.074   -1.022  130.9  1.77  74.1   18.8  0.80  23.4
IGR J17464-3213       266.567  -32.229  357.260   -1.832    9.5  0.46  20.7    1.2  0.28   4.2
MXB 1730-335          263.330  -33.402  354.820   -0.152   11.6  1.03  11.2    1.9  0.65   3.0
SLX 1744-299_300      266.858  -29.999  359.297   -0.889    1.3  0.30   4.3    0.4  0.18   2.3
XTE J1739-285         264.969  -28.494  359.713   +1.303    6.5  0.31  20.9    0.9  0.18   4.9
CONFUSED ID           270.288  -25.084    5.075   -1.024  131.4  1.77  74.2   18.8  0.80  23.4
CONFUSED ID           270.253  -25.155    4.997   -1.031   32.6  1.44  22.6    5.2  0.71   7.4
NEW SOURCE            272.098  -26.261    4.846   -3.022    9.1  2.26   4.0    0.0  0.00   0.0
NEW SOURCE            268.497  -26.807    2.776   -0.493    2.1  0.44   4.7    0.0  0.00   0.0
NEW SOURCE            271.634  -26.382    4.539   -2.717    6.0  1.41   4.2    0.0  0.00   0.0
NEW SOURCE            268.856  -31.233  359.112   -2.997    0.0  0.00   0.0    0.9  0.28   3.3
KS 1741-293           266.217  -29.333  359.576   -0.067    1.0  0.29   3.4    0.5  0.17   2.7