INTEGRAL Galactic bulge Monitoring
Revolution 0299: Observation start 2005-03-25T22:30 = MJD 53454.938
Total Observation GTI = 11928 seconds
IBIS/ISGRI
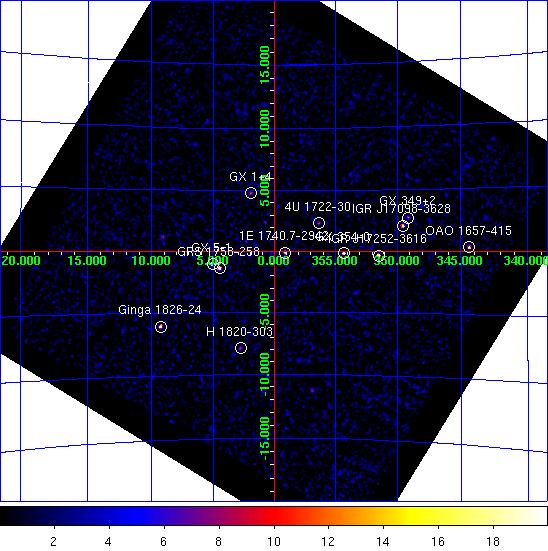
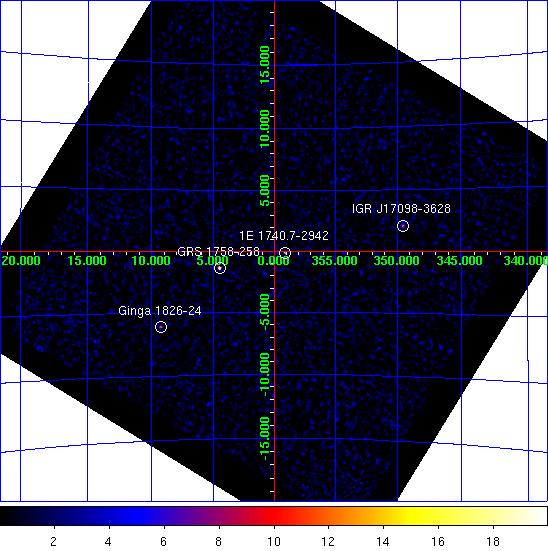
IBIS/ISGRI significance mosaic images. Left: IBIS/ISGRI 18-40 keV. Right: 40-100 keV
Sources detected > 10σ in each band are marked on the image. The table below lists the fitted position, and statistical positional uncertainty in arcmin returned by the mosaic step of
OSA10.1, of all the sources detected in the 18 - 40 keV range (band A: 1 Crab ~ 208 cps ) and 40 - 100 keV range (band B: 1 Crab ~ 100 cps ) where available.NOTES: The table is constructed from the
isgri_mosa_res.fits file - fluxes in the mosaic output are known to be systematically ~10% lower than in the ScW light-curves (see known issues). The systematic noise increases towards the edge of the field of view and NEW SOURCEs < 6σ towards the border of the image may be spurious. IBIS/ISGRI Detected Sources 18-40 keV (A) and 40-100 keV (B)
Source Name             RA       dec   +/-    l        b     A(cps)  +/-   sig  B(cps)  +/-   sig
==================== ========  ======= === ======== ======== ====== ===== ===== ====== ===== =====
GX 5-1                270.289  -25.084 0.7    5.075   -1.024   16.5  0.31  52.6    1.0  0.00   4.0
IGR J17252-3616       261.297  -36.291 0.8  351.490   -0.358   16.9  0.40  42.3    1.5  0.32   4.8
GRS 1758-258          270.306  -25.740 0.9    4.513   -1.363   12.2  0.35  35.3    7.9  0.28  28.6
GX 354-0              263.003  -33.829 1.0  354.313   -0.156   10.4  0.35  30.0    1.4  0.28   5.2
Ginga 1826-24         277.362  -23.788 1.1    9.278   -6.079   16.6  0.58  28.7    6.4  0.44  14.5
1E 1740.7-2942        265.971  -29.748 1.2  359.110   -0.102    8.1  0.32  25.0    4.3  0.27  16.2
OAO 1657-415          255.181  -41.661 1.2  344.355   +0.329   33.3  1.38  24.2    6.7  1.02   6.6
IGR J17098-3628       257.443  -36.470 1.3  349.551   +2.071   12.2  0.55  22.4    5.2  0.42  12.4
GX 349+2              256.449  -36.412 2.2  349.119   +2.747    6.6  0.53  12.5    0.0  0.00   0.0
GX 1+4                263.023  -24.759 2.0    1.933   +4.777    4.3  0.32  13.4    0.0  0.00   0.0
4U 1722-30            261.886  -30.776 2.3  356.340   +2.314    3.6  0.31  11.8    0.9  0.25   3.8
H 1820-303            275.908  -30.361 2.3    2.784   -7.905    5.7  0.50  11.4    0.0  0.00   0.0
3A 1822-371           276.423  -37.075 2.8  356.870  -11.262    6.4  0.67   9.5    0.0  0.00   0.0
GX 9+1                270.366  -20.486 2.9    9.106   +1.190    4.2  0.47   8.9    0.0  0.00   0.0
SLX 1735-269          264.564  -27.026 2.8    0.765   +2.388    2.7  0.29   9.3    0.0  0.00   0.0
GX 3+1                266.940  -26.532 3.1    2.301   +0.843    2.6  0.31   8.4    0.0  0.00   0.0
XTE J1743-363         265.688  -36.364 4.1  353.349   -3.369    2.3  0.37   6.1    1.4  0.30   4.6
GX 13+1               273.602  -17.157 3.9   13.504   +0.131    5.2  0.80   6.5    0.0  0.00   0.0
SLX 1744-299_300      266.860  -30.078 6.1  359.230   -0.931    1.3  0.34   4.0    0.0  0.00   0.0
1A 1743-288           266.674  -28.812 6.2    0.228   -0.137    1.1  0.28   3.9    0.0  0.00   0.0
AX J1749.1-2733       267.278  -27.537 5.0    1.595   +0.067    1.5  0.31   5.0    0.0  0.00   0.0
IGR J17191-2821       259.710  -28.260 5.5  357.357   +5.295    1.5  0.34   4.4    0.0  0.00   0.0
IGR J17473-2721       266.860  -27.340 5.2    1.572   +0.486    1.4  0.30   4.8    0.0  0.00   0.0
Oph Cluster           258.011  -23.412 5.9    0.483   +9.324    1.9  0.00   4.1    0.0  0.00   0.0
SLX 1737-282          265.212  -28.245 6.0    0.038   +1.254    1.3  0.32   4.1    0.0  0.00   0.0
GX 17+2               274.026  -14.006 5.3   16.468   +1.275   12.2  2.63   4.6    0.0  0.00   0.0
IGR J17195-4100       259.902  -40.986 6.5  347.003   -2.122    3.0  0.80   3.7    0.0  0.00   0.0
IGR J17088-4008       257.175  -40.048 6.3  346.552   +0.108    3.2  0.82   3.9    0.0  0.00   0.0
IGR J18249-3243       276.305  -32.668 5.7    0.852   -9.242    2.0  0.46   4.3    0.0  0.00   0.0
JEM-X
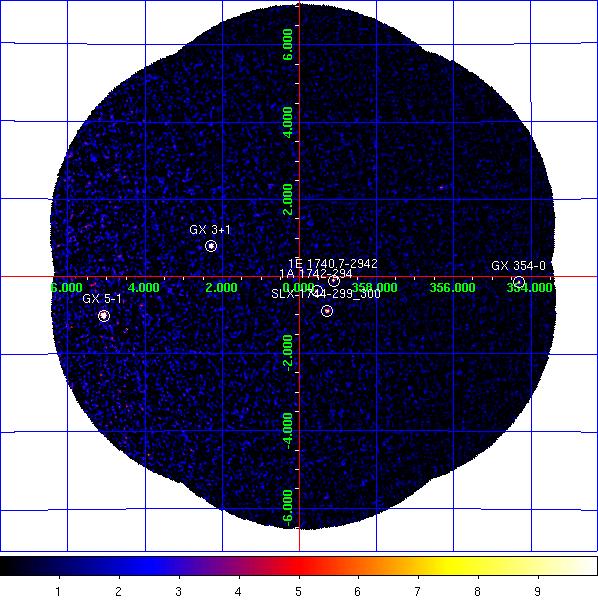
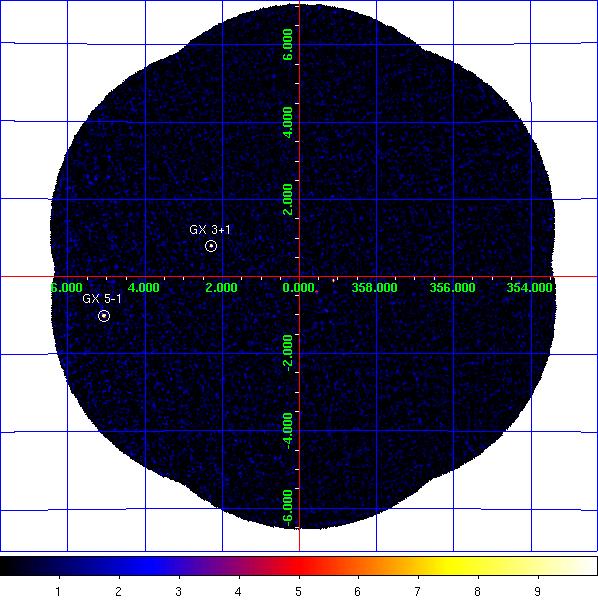
JEM-X1 significance mosaic images. Left: 3-10 keV. Right: 10-25 keV.
Sources labelled were detected in the 3-10 keV image > 6σ. The sources detected above 3σ in the 3-10 keV and/or 10-25 keV band are listed in the table below. Fluxes are extracted at the known catalogue position of the source (i.e. no fitting of the source position is done), with
mosaic_spec, in two bands: A = 3-10 keV (1 Crab ~ 97 cps [J1], 103 cps [J2]); B = 10-25 keV (1 Crab ~ 29 cps [J1], 27 cps [J2]). NOTES: The object marked as SLX 1744-299_300 is used to indicate two low-mass x-ray binaries separated by 2.7 arcminutes, SLX 1744-299 and SLX 1744-300; the position for SLX 1744-299 is used, although it can not be ruled out that SLX 1744-300 may dominate the emission some of the time. The systematic noise increases towards the edge of the field of view and in the vicinity of very bright sources, such as GX 5-1;
NEW SOURCEs < 6σ towards the border of the image and/or near GX 5-1 may, therefore, be spurious.
JEM-X1 Detected Sources in 3-10 keV (A) and 10-25 keV (B).
Source Name             RA       dec      l        b     A(cps)  +/-   sig  B(cps)  +/-   sig
==================== ========  ======= ======== ======== ====== ===== ===== ====== ===== =====
1A 1742-294           266.500  -29.524  359.542   -0.377    1.9  0.22   8.9    0.6  0.13   4.7
1E 1740.7-2942        265.978  -29.745  359.116   -0.106    2.1  0.21   9.7    0.0  0.00   0.0
4U 1722-30            261.888  -30.802  356.320   +2.298    1.9  0.37   5.3    0.6  0.26   2.2
GRS 1741.9-2853       266.260  -28.914  359.953   +0.120    0.9  0.22   4.1    0.0  0.00   0.0
GX 3+1                266.985  -26.566    2.292   +0.791   19.6  0.35  56.1    2.1  0.18  11.6
GX 354-0              262.989  -33.835  354.302   -0.150    8.5  0.76  11.1    2.3  0.58   4.0
GX 5-1                270.283  -25.088    5.069   -1.022  120.5  1.73  69.8   15.4  0.77  20.0
SLX 1744-299_300      266.858  -29.999  359.297   -0.889    3.0  0.23  12.9    0.4  0.14   3.0
NEW SOURCE            270.168  -24.958    5.130   -0.867    4.9  1.39   3.6    1.8  0.68   2.6