INTEGRAL Galactic bulge Monitoring
Revolution 0296: Observation start 2005-03-17T18:09 = MJD 53446.757
Total Observation GTI = 12207 seconds
IBIS/ISGRI
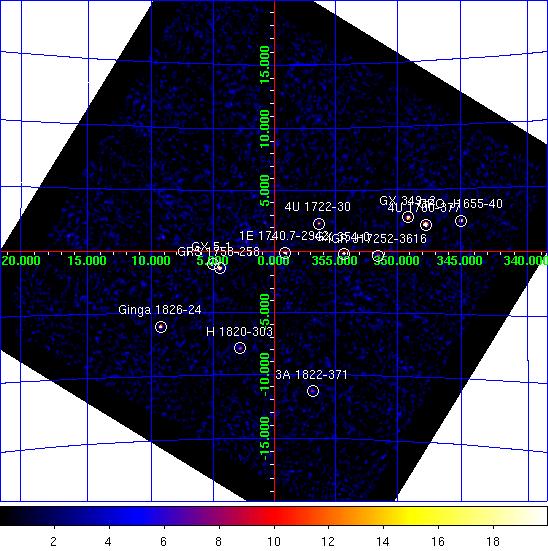
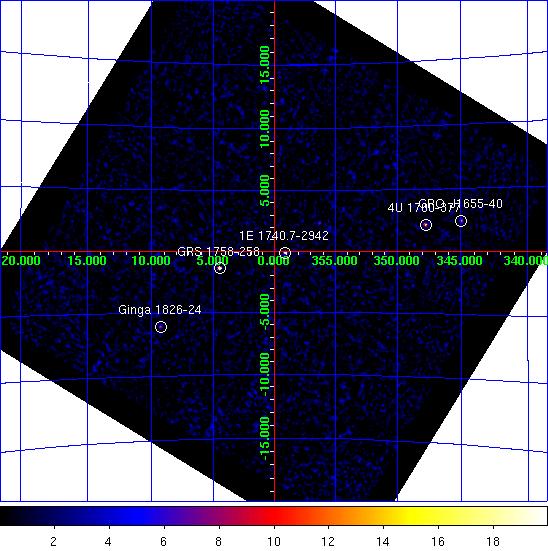
IBIS/ISGRI significance mosaic images. Left: IBIS/ISGRI 18-40 keV. Right: 40-100 keV
Sources detected > 10σ in each band are marked on the image. The table below lists the fitted position, and statistical positional uncertainty in arcmin returned by the mosaic step of
OSA10.1, of all the sources detected in the 18 - 40 keV range (band A: 1 Crab ~ 208 cps ) and 40 - 100 keV range (band B: 1 Crab ~ 100 cps ) where available.NOTES: The table is constructed from the
isgri_mosa_res.fits file - fluxes in the mosaic output are known to be systematically ~10% lower than in the ScW light-curves (see known issues). The systematic noise increases towards the edge of the field of view and NEW SOURCEs < 6σ towards the border of the image may be spurious. IBIS/ISGRI Detected Sources 18-40 keV (A) and 40-100 keV (B)
Source Name             RA       dec   +/-    l        b     A(cps)  +/-   sig  B(cps)  +/-   sig
==================== ========  ======= === ======== ======== ====== ===== ===== ====== ===== =====
4U 1700-377           255.986  -37.853 0.6  347.747   +2.168   33.9  0.60  56.2    7.8  0.45  17.2
GX 5-1                270.282  -25.073 0.8    5.082   -1.013   16.3  0.36  44.7    0.0  0.00   0.0
GRS 1758-258          270.296  -25.746 0.8    4.503   -1.358   12.3  0.32  38.5    8.4  0.25  33.3
GX 349+2              256.439  -36.422 0.9  349.106   +2.747   19.6  0.55  35.6    0.0  0.00   0.0
1E 1740.7-2942        265.970  -29.745 0.9  359.112   -0.099   10.1  0.29  34.4    5.9  0.24  24.5
Ginga 1826-24         277.358  -23.796 1.1    9.270   -6.080   16.7  0.61  27.4    5.0  0.46  10.8
GX 354-0              263.014  -33.842 1.2  354.308   -0.171    7.9  0.33  24.2    0.0  0.00   0.0
GRO J1655-40          253.511  -39.841 1.2  344.991   +2.453   29.1  1.14  25.5   11.0  0.83  13.2
4U 1722-30            261.894  -30.794 1.9  356.330   +2.298    4.8  0.33  14.8    2.2  0.26   8.2
IGR J17252-3616       261.308  -36.276 2.1  351.508   -0.357    5.3  0.41  13.0    1.2  0.32   3.7
H 1820-303            275.912  -30.332 2.1    2.812   -7.895    6.1  0.47  12.8    0.0  0.00   0.0
3A 1822-371           276.480  -37.097 2.6  356.870  -11.313    6.1  0.60  10.1    0.0  0.00   0.0
GX 3+1                267.011  -26.591 3.5    2.283   +0.758    2.1  0.29   7.3    0.0  0.00   0.0
GX 9+1                270.364  -20.503 3.3    9.090   +1.183    3.3  0.42   7.8    0.0  0.00   0.0
GX 17+2               274.040  -14.047 3.7   16.438   +1.243   16.5  2.41   6.8    0.0  0.00   0.0
SLX 1735-269          264.585  -27.021 3.7    0.780   +2.376    2.2  0.32   6.9    0.0  0.00   0.0
1A 1742-294           266.519  -29.528 4.2  359.547   -0.393    1.7  0.29   6.0    0.0  0.00   0.0
SLX 1744-299_300      266.801  -29.982 4.6  359.286   -0.838    1.8  0.33   5.4    0.0  0.00   0.0
IGR J17091-3624       257.344  -36.347 5.5  349.603   +2.208    2.3  0.53   4.5    0.0  0.00   0.0
V2400 Oph             258.041  -24.309 5.5  359.755   +8.786    1.9  0.42   4.5    0.0  0.00   0.0
AX J1749.1-2733       267.197  -27.545 7.6    1.551   +0.124    1.1  0.35   3.2    0.0  0.00   0.0
1A 1744-361           267.107  -36.234 5.1  354.054   -4.280    1.9  0.40   4.8    0.0  0.00   0.0
IGR J18027-2016       270.683  -20.239 0.0    9.468   +1.053    1.8  0.00   4.2    0.0  0.00   0.0
3A 1728-169           262.943  -16.953 4.6    8.525   +9.035    3.7  0.69   5.4    0.0  0.00   0.0
GRS 1734-292          264.393  -29.152 5.9  358.887   +1.380    1.2  0.29   4.1    0.0  0.00   0.0
IGR J17475-2822       266.824  -28.335 7.4    0.705   -0.002    1.0  0.29   3.2    0.0  0.00   0.0
SLX 1737-282          265.148  -28.335 7.1  359.932   +1.254    1.0  0.28   3.4    0.0  0.00   0.0
IGR J17473-2721       266.744  -27.391 0.0    1.475   +0.548    1.3  0.00   3.8    0.0  0.00   0.0
GX 13+1               273.570  -17.209 0.0   13.444   +0.133    3.0  0.00   3.7    0.0  0.00   0.0
1A 1743-288           266.659  -28.955 6.5    0.100   -0.200    1.0  0.00   3.7    0.0  0.00   0.0
XTE J1743-363         265.893  -36.400 0.0  353.404   -3.529    1.4  0.00   3.7    0.0  0.00   0.0
XB 1832-330           278.967  -33.028 5.9    1.509  -11.413    2.6  0.64   4.1    2.6  0.48   5.3
JEM-X
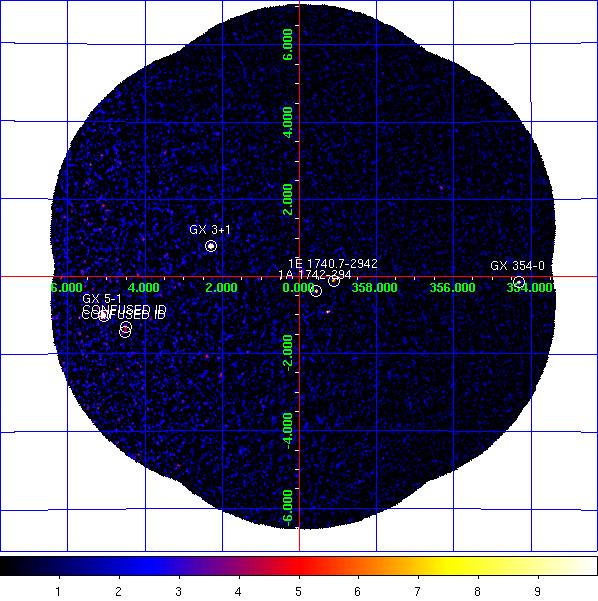
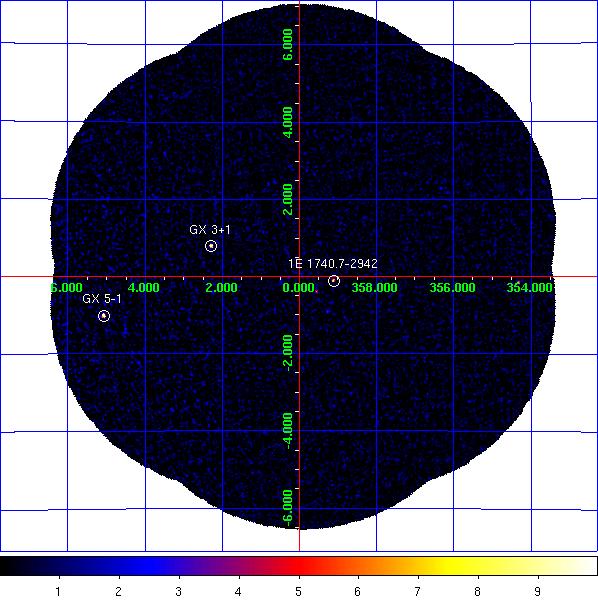
JEM-X1 significance mosaic images. Left: 3-10 keV. Right: 10-25 keV.
Sources labelled were detected in the 3-10 keV image > 6σ. The sources detected above 3σ in the 3-10 keV and/or 10-25 keV band are listed in the table below. Fluxes are extracted at the known catalogue position of the source (i.e. no fitting of the source position is done), with
mosaic_spec, in two bands: A = 3-10 keV (1 Crab ~ 97 cps [J1], 103 cps [J2]); B = 10-25 keV (1 Crab ~ 29 cps [J1], 27 cps [J2]). NOTES: The object marked as SLX 1744-299_300 is used to indicate two low-mass x-ray binaries separated by 2.7 arcminutes, SLX 1744-299 and SLX 1744-300; the position for SLX 1744-299 is used, although it can not be ruled out that SLX 1744-300 may dominate the emission some of the time. The systematic noise increases towards the edge of the field of view and in the vicinity of very bright sources, such as GX 5-1;
NEW SOURCEs < 6σ towards the border of the image and/or near GX 5-1 may, therefore, be spurious.
JEM-X1 Detected Sources in 3-10 keV (A) and 10-25 keV (B).
Source Name             RA       dec      l        b     A(cps)  +/-   sig  B(cps)  +/-   sig
==================== ========  ======= ======== ======== ====== ===== ===== ====== ===== =====
1A 1742-294           266.528  -29.503  359.572   -0.386    2.5  0.22  11.1    0.6  0.13   4.6
1E 1740.7-2942        265.978  -29.745  359.116   -0.106    2.0  0.22   9.3    1.2  0.13   9.4
1E 1743.1-2843        266.587  -28.729    0.260   -0.029    0.8  0.23   3.6    0.3  0.13   2.2
4U 1722-30            261.888  -30.802  356.320   +2.298    1.9  0.37   5.2    0.6  0.25   2.4
GRS 1741.9-2853       266.260  -28.914  359.953   +0.120    1.1  0.23   4.8    0.0  0.00   0.0
GRS 1758-258          270.303  -25.741    4.511   -1.361    5.1  1.06   4.8    1.2  0.51   2.4
GX 3+1                266.988  -26.562    2.298   +0.791   25.5  0.37  68.8    2.7  0.18  14.9
GX 354-0              262.995  -33.821  354.316   -0.147   12.8  0.85  15.1    3.3  0.59   5.6
GX 5-1                270.283  -25.075    5.080   -1.016  128.3  1.86  68.9   16.9  0.80  21.2
SLX 1744-299_300      266.858  -29.999  359.297   -0.889    1.1  0.24   4.6    0.3  0.14   2.5
CONFUSED ID           270.243  -25.708    4.512   -1.298    6.6  1.05   6.3    0.9  0.49   1.9
NEW SOURCE            269.824  -27.925    2.401   -2.073    2.6  0.46   5.7    0.4  0.25   1.6
CONFUSED ID           270.383  -25.758    4.532   -1.432    6.7  1.11   6.1    1.4  0.56   2.5
NEW SOURCE            270.089  -28.478    2.036   -2.551    2.6  0.45   5.7    0.0  0.00   0.0
NEW SOURCE            267.827  -24.966    4.055   +0.963    3.2  0.65   4.9    0.0  0.00   0.0
NEW SOURCE            269.494  -24.037    5.623   +0.123    9.1  1.80   5.0    0.0  0.00   0.0