INTEGRAL Galactic bulge Monitoring
Revolution 0287: Observation start 2005-02-18T07:12 = MJD 53419.301
Total Observation GTI = 11504 seconds
IBIS/ISGRI
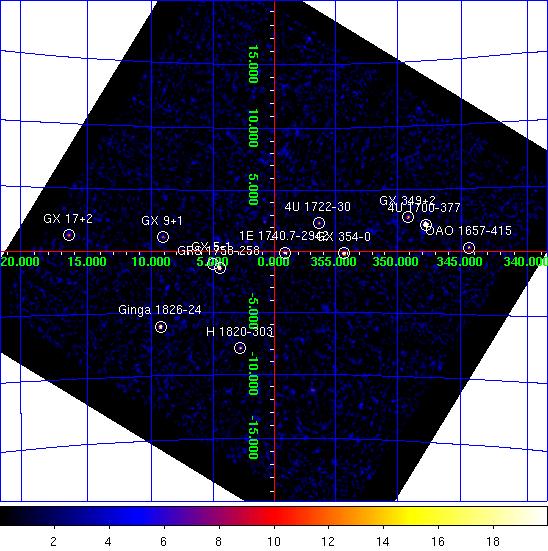
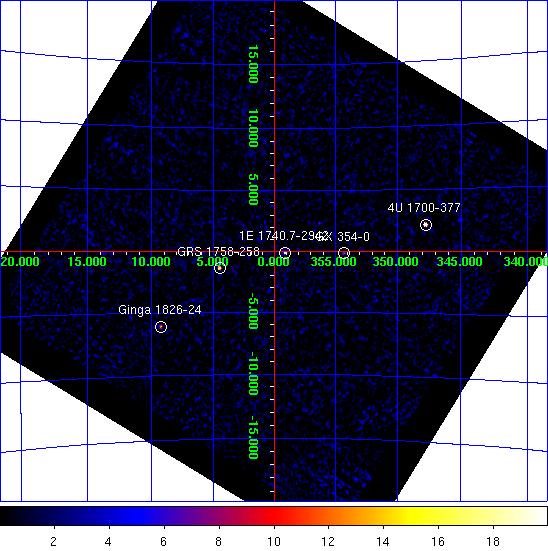
IBIS/ISGRI significance mosaic images. Left: IBIS/ISGRI 18-40 keV. Right: 40-100 keV
Sources detected > 10σ in each band are marked on the image. The table below lists the fitted position, and statistical positional uncertainty in arcmin returned by the mosaic step of
OSA10.1, of all the sources detected in the 18 - 40 keV range (band A: 1 Crab ~ 208 cps ) and 40 - 100 keV range (band B: 1 Crab ~ 100 cps ) where available.NOTES: The table is constructed from the
isgri_mosa_res.fits file - fluxes in the mosaic output are known to be systematically ~10% lower than in the ScW light-curves (see known issues). The systematic noise increases towards the edge of the field of view and NEW SOURCEs < 6σ towards the border of the image may be spurious. IBIS/ISGRI Detected Sources 18-40 keV (A) and 40-100 keV (B)
Source Name             RA       dec   +/-    l        b     A(cps)  +/-   sig  B(cps)  +/-   sig
==================== ========  ======= === ======== ======== ====== ===== ===== ====== ===== =====
4U 1700-377           255.987  -37.853 0.4  347.747   +2.168   92.2  0.72 128.5   22.9  0.52  43.6
GX 354-0              262.989  -33.839 0.7  354.299   -0.152   14.9  0.32  46.8    3.1  0.25  12.2
GRS 1758-258          270.287  -25.743 0.9    4.502   -1.350   12.1  0.36  33.6    7.8  0.28  27.8
1E 1740.7-2942        265.970  -29.739 1.0  359.117   -0.096    9.8  0.31  31.6    5.8  0.25  22.9
Ginga 1826-24         277.370  -23.791 1.2    9.278   -6.087   14.0  0.54  25.8    6.4  0.41  15.5
GX 5-1                270.272  -25.065 1.4    5.084   -1.002    7.9  0.37  21.3    0.0  0.00   0.0
H 1820-303            275.913  -30.348 1.6    2.797   -7.903    8.2  0.45  18.2    0.0  0.00   0.0
OAO 1657-415          255.210  -41.654 1.6  344.374   +0.317   22.8  1.33  17.1    5.1  0.92   5.5
GX 349+2              256.425  -36.411 1.7  349.108   +2.763    9.0  0.55  16.5    0.0  0.00   0.0
GX 17+2               273.986  -14.025 1.9   16.433   +1.299   32.5  2.27  14.3    0.0  0.00   0.0
4U 1722-30            261.876  -30.782 2.1  356.331   +2.318    4.1  0.31  13.2    1.5  0.24   6.3
GX 9+1                270.373  -20.522 2.0    9.078   +1.167    5.9  0.45  13.3    0.0  0.00   0.0
3A 1822-371           276.416  -37.095 3.1  356.849  -11.266    5.8  0.69   8.4    0.0  0.00   0.0
SLX 1735-269          264.519  -26.964 3.2    0.797   +2.456    2.4  0.30   8.1    1.2  0.24   4.9
GX 3+1                266.964  -26.563 3.5    2.285   +0.809    2.1  0.29   7.4    0.0  0.00   0.0
SLX 1744-299_300      266.814  -30.042 4.5  359.241   -0.879    1.6  0.29   5.5    0.0  0.00   0.0
IGR J17252-3616       261.298  -36.263 4.7  351.514   -0.343    2.3  0.43   5.3    0.0  0.00   0.0
V2400 Oph             258.208  -24.199 4.7  359.935   +8.725    2.3  0.43   5.3    0.0  0.00   0.0
SAX J1712.6-3739      258.151  -37.660 5.3  348.925   +0.912    2.7  0.57   4.7    0.0  0.00   0.0
GRS 1734-292          264.355  -29.134 5.6  358.884   +1.417    1.5  0.35   4.4    0.0  0.00   0.0
IGR J17473-2721       266.757  -27.332 5.7    1.532   +0.568    1.2  0.28   4.3    0.0  0.00   0.0
GRO J1655-40          253.409  -39.860 6.2  344.926   +2.502    4.0  1.02   3.9    0.0  0.00   0.0
IGR J17445-2747       266.145  -27.730 6.3    0.909   +0.825    1.1  0.00   3.8    0.0  0.00   0.0
IGR J18048-1455       271.285  -14.888 6.5   14.416   +3.177    5.5  0.00   3.7    0.0  0.00   0.0
GX 13+1               273.586  -17.075 5.8   13.568   +0.184    3.4  0.81   4.2    0.0  0.00   0.0
SGR J1745-29          266.503  -29.025 7.5  359.968   -0.120    1.1  0.33   3.2    0.0  0.00   0.0
IGR J17488-2338       267.049  -23.549 6.6    4.907   +2.299    1.2  0.00   3.7    0.0  0.00   0.0
JEM-X
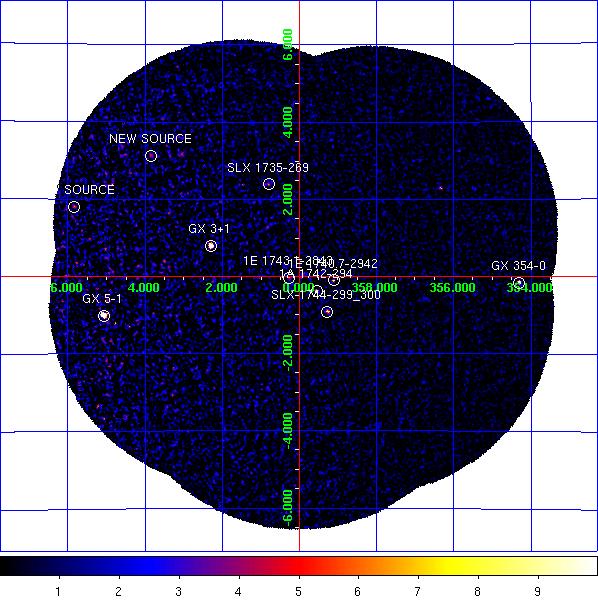
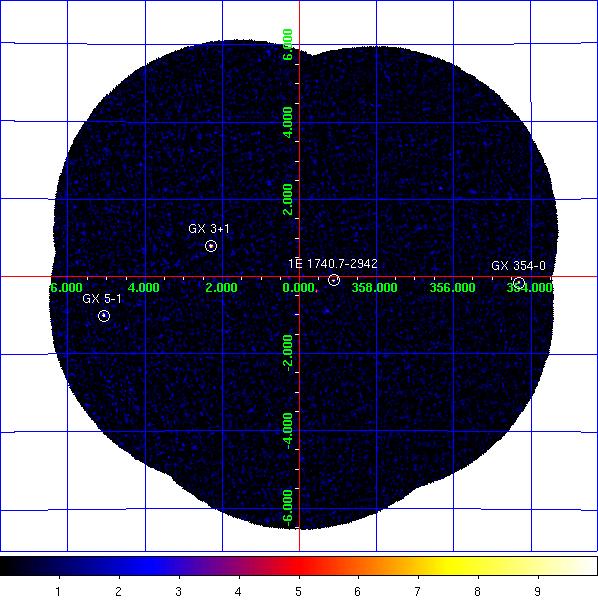
JEM-X1 significance mosaic images. Left: 3-10 keV. Right: 10-25 keV.
Sources labelled were detected in the 3-10 keV image > 6σ. The sources detected above 3σ in the 3-10 keV and/or 10-25 keV band are listed in the table below. Fluxes are extracted at the known catalogue position of the source (i.e. no fitting of the source position is done), with
mosaic_spec, in two bands: A = 3-10 keV (1 Crab ~ 97 cps [J1], 103 cps [J2]); B = 10-25 keV (1 Crab ~ 29 cps [J1], 27 cps [J2]). NOTES: The object marked as SLX 1744-299_300 is used to indicate two low-mass x-ray binaries separated by 2.7 arcminutes, SLX 1744-299 and SLX 1744-300; the position for SLX 1744-299 is used, although it can not be ruled out that SLX 1744-300 may dominate the emission some of the time. The systematic noise increases towards the edge of the field of view and in the vicinity of very bright sources, such as GX 5-1;
NEW SOURCEs < 6σ towards the border of the image and/or near GX 5-1 may, therefore, be spurious.
JEM-X1 Detected Sources in 3-10 keV (A) and 10-25 keV (B).
Source Name             RA       dec      l        b     A(cps)  +/-   sig  B(cps)  +/-   sig
==================== ========  ======= ======== ======== ====== ===== ===== ====== ===== =====
1A 1742-294           266.493  -29.526  359.536   -0.373    2.3  0.22  10.5    0.6  0.13   4.8
1E 1740.7-2942        265.972  -29.743  359.115   -0.100    1.5  0.21   7.3    1.0  0.13   7.8
1E 1743.1-2843        266.587  -28.729    0.260   -0.029    1.5  0.23   6.8    0.4  0.13   3.0
4U 1722-30            261.888  -30.802  356.320   +2.298    2.0  0.34   6.0    0.8  0.23   3.2
GX 3+1                266.988  -26.555    2.303   +0.795   24.5  0.38  64.8    2.7  0.18  15.0
GX 354-0              263.000  -33.835  354.307   -0.158   12.3  0.71  17.3    4.1  0.55   7.6
GX 5-1                270.284  -25.077    5.079   -1.017  126.1  1.83  68.9   11.1  0.79  14.0
SLX 1735-269          264.571  -26.994    0.796   +2.400    1.8  0.29   6.1    0.5  0.17   2.8
SLX 1744-299_300      266.869  -30.026  359.278   -0.911    2.3  0.22  10.2    0.5  0.13   3.5
Swift J174535.5-2901  266.398  -29.026  359.920   -0.042    0.7  0.22   3.4    0.2  0.13   1.4
NEW SOURCE            268.026  -23.006    5.834   +1.806   13.6  2.13   6.4    2.4  1.28   1.9
NEW SOURCE            265.668  -24.020    3.847   +3.134    4.9  0.78   6.3    0.0  0.00   0.0
NEW SOURCE            269.824  -23.743    6.029   +0.009   11.9  2.19   5.4    1.6  1.11   1.4
NEW SOURCE            261.377  -25.131    0.798   +5.821    0.0  0.00   0.0    3.4  1.10   3.1