Proposal Details - 1020018
Helium-rich thermonuclear bursts from the Slow Burster (Galloway)
Proposal Abstract
Thermonuclear bursts in systems accreting pure helium reveal the structure of the neutron star (NS) interiors. In the absence of heating from steady H-burning between bursts, the burst recurrence times and energetics are much more sensitive to the thermal properties and processes in the NS crust and core. Interestingly, burst ignition models predict significantly longer burst recurrence times than observed for such sources. One way to resolve this discrepancy is fractional covering of the accreted fuel on the NS surface, and recent analysis of a large sample of bursts from 4U 172834 appears to lend support to this hypothesis. However, a large variation in the properties of bursts observed at similar accretion rates suggests that other processes, perhaps including steady He-burning or incomplete burning, may also be important.We propose to observe 4U 172834 with INTEGRAL and XMM-Newton simultaneously, in order to measure the burst recurrence time and the persistent X-ray flux (and hence the accretion rate) in the broadest possible band, to distinguish between these possibilities. The precise accretion rate measured over a wide, multi-instrument energy band is crucial, as it will enable detection of additional soft (or hard) spectral components outside the sensitivity band of individual detectors. The results of this study will provide stringent constraints for modeling of burst ignition conditions.
Observation Strategy (Recommended by TAC)
One 210 ks-long uninterrupted observation with the hexagonal dither pattern during a full INTEGRAL orbit on 4U 1728-34 at RA, Dec (J2000.0, in degrees) = 262.991, -33.834 (l, b = 354.303, - 0.151 degrees), simultaneously with a 10 ks XMM-Newton observation.
Proposal grade: B
Data Rights (Recommended by TAC)
Data rights were granted on 4U 1728-34.
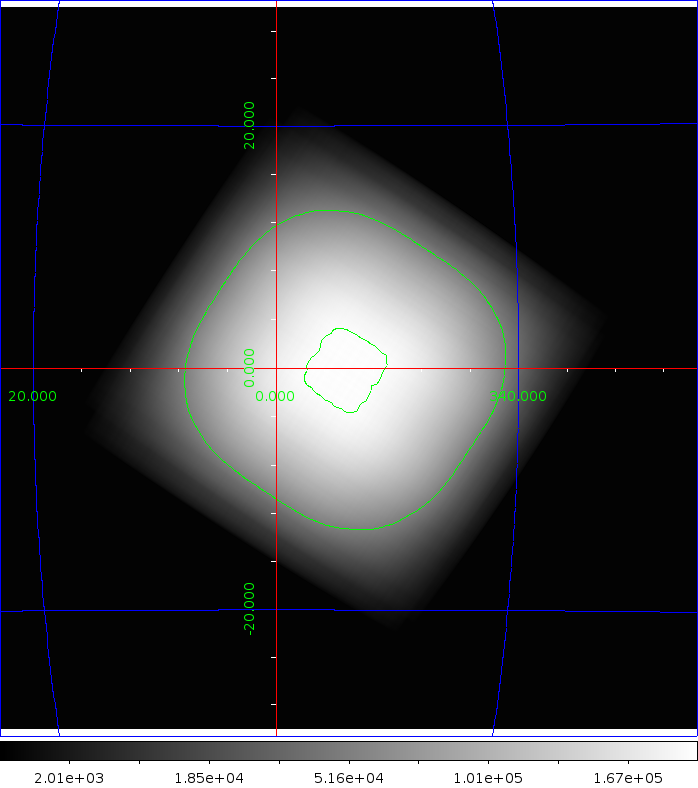
Exposure Map
The exposure maps are in galactic coordinates using the Aitoff projection and units of seconds, and the colour scale is indicated at the bottom. The green lines provide the 50, 200, 350, 500 and 650 ksec contour.
